Blog

  • Iterating 2

    1.Waste Apple

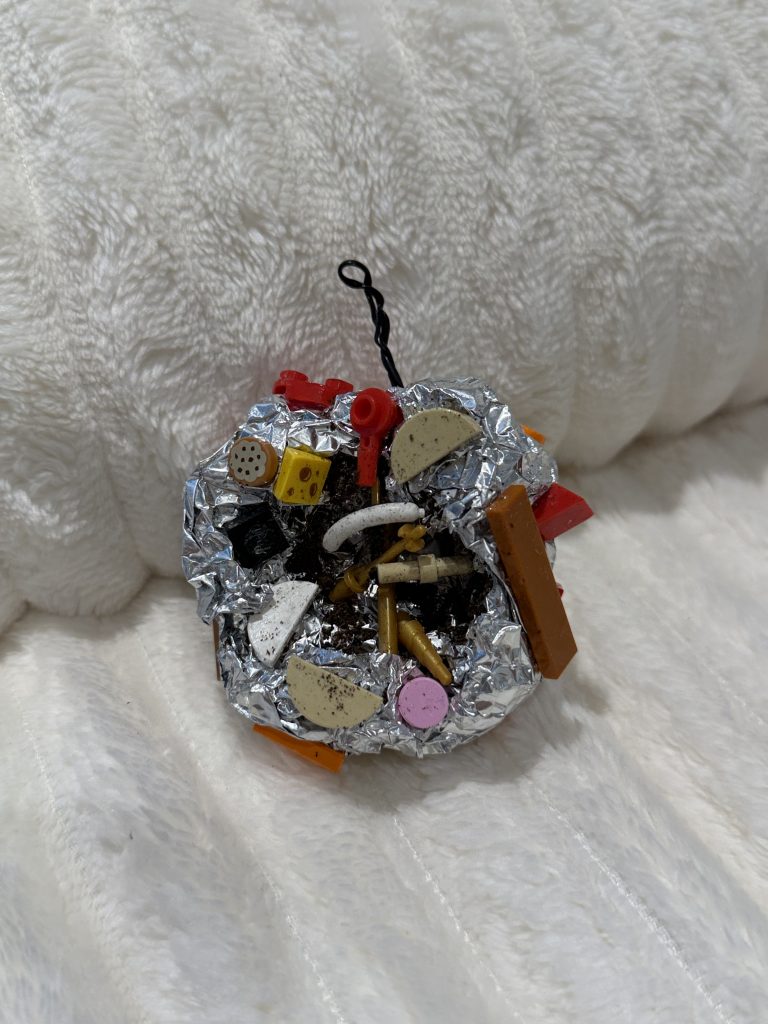
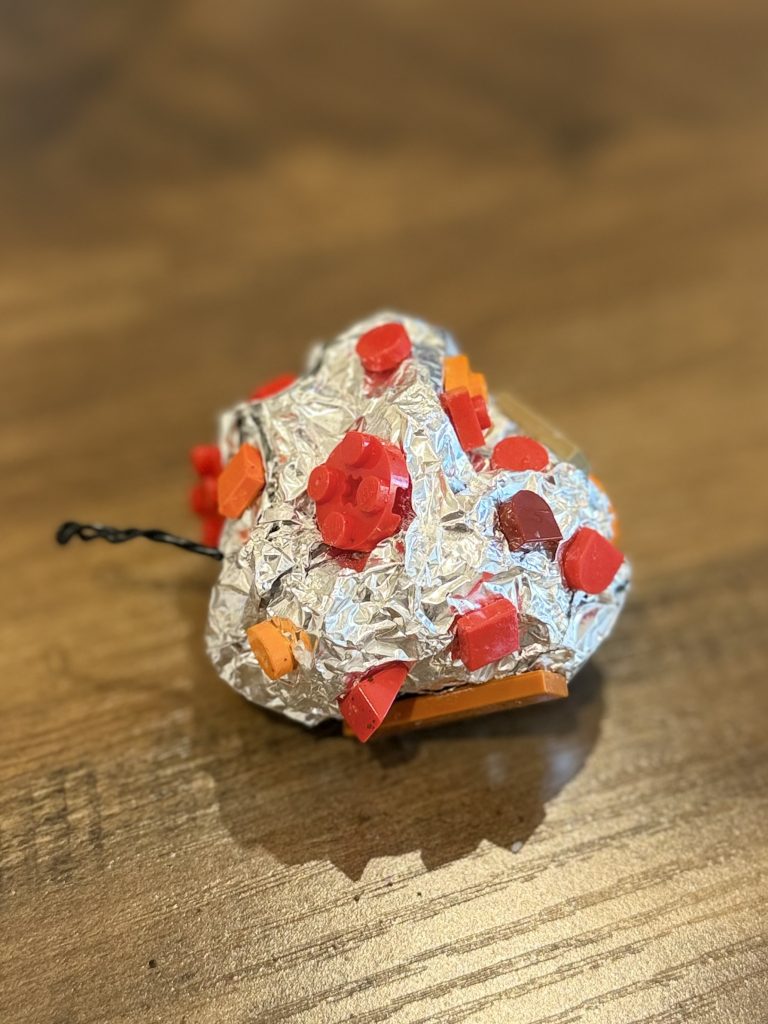
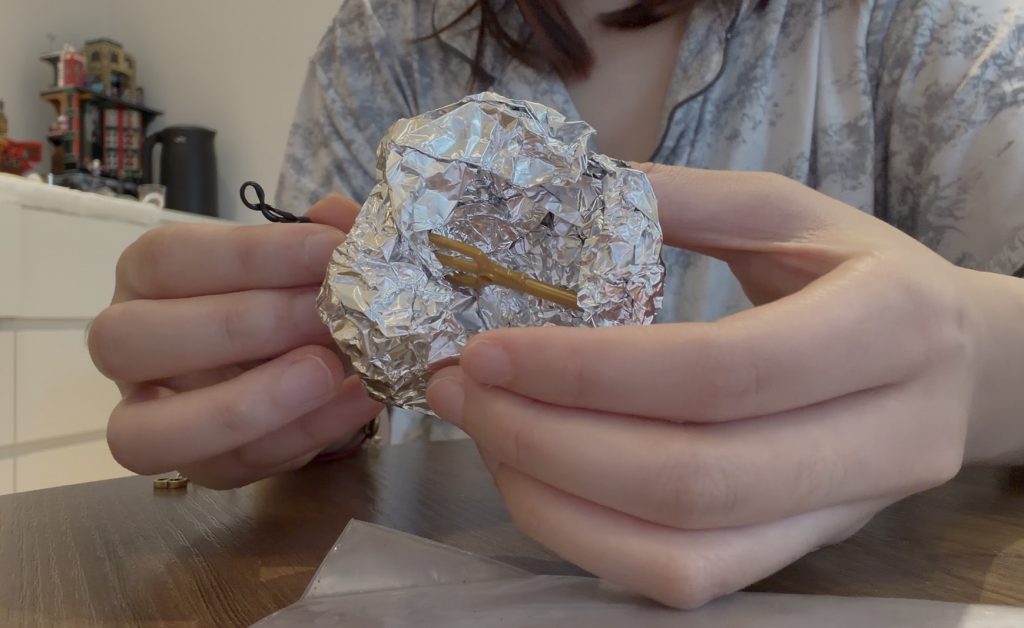
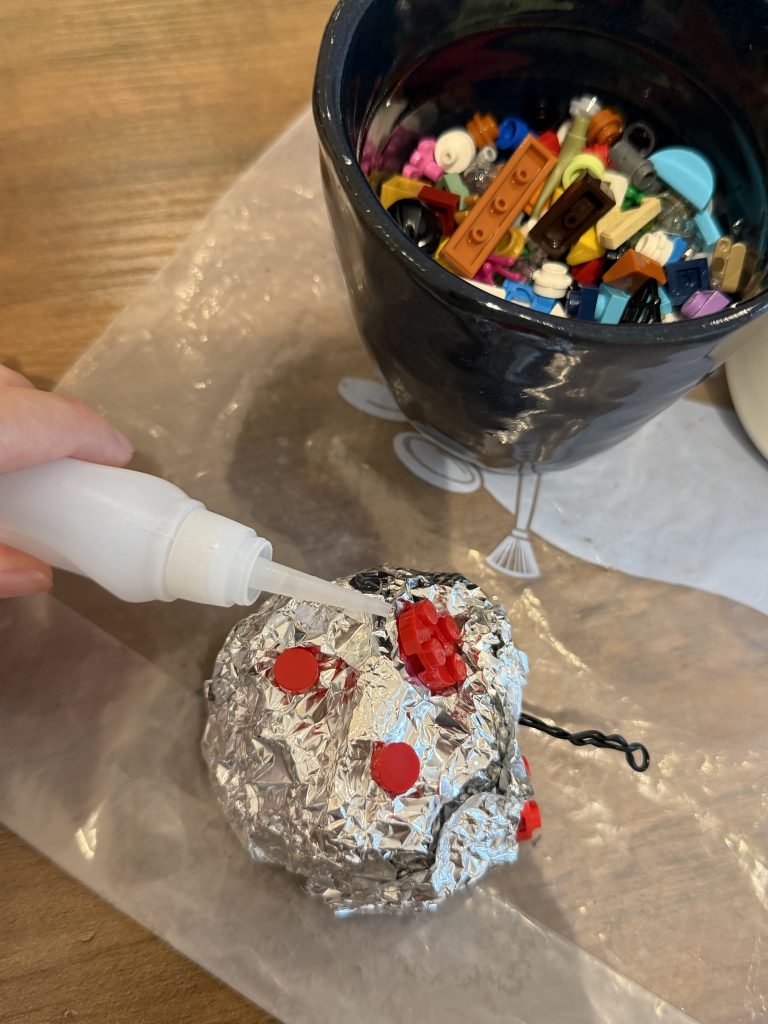
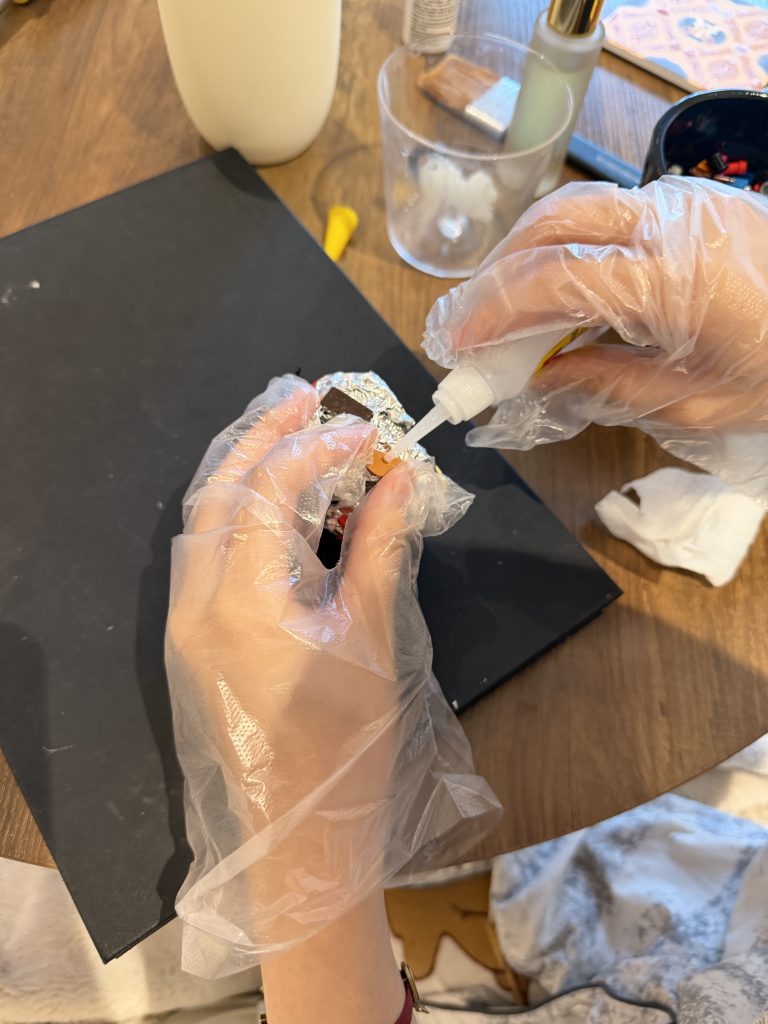
    Following my tutor’s suggestion to step away from traditional sculpted forms and lean into everyday randomness, I developed a new physical iteration using household waste and found objects. Instead of controlling the material to achieve an ideal shape, I allowed the raw friction and logic of discarded items to dictate the apple’s structure.
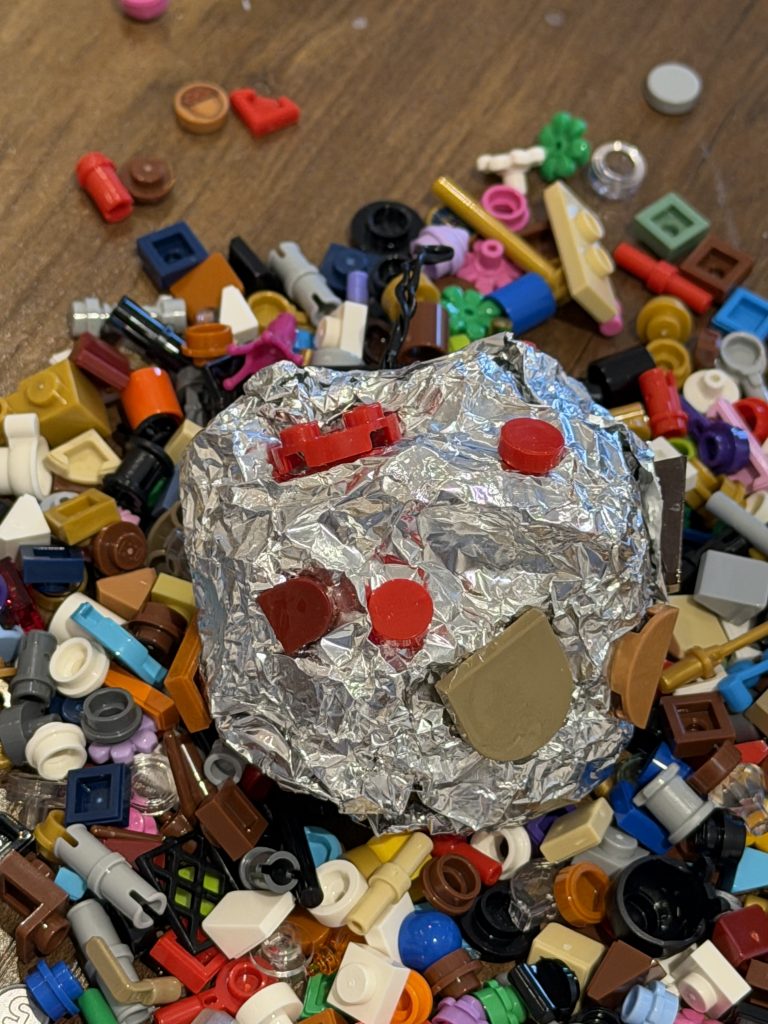
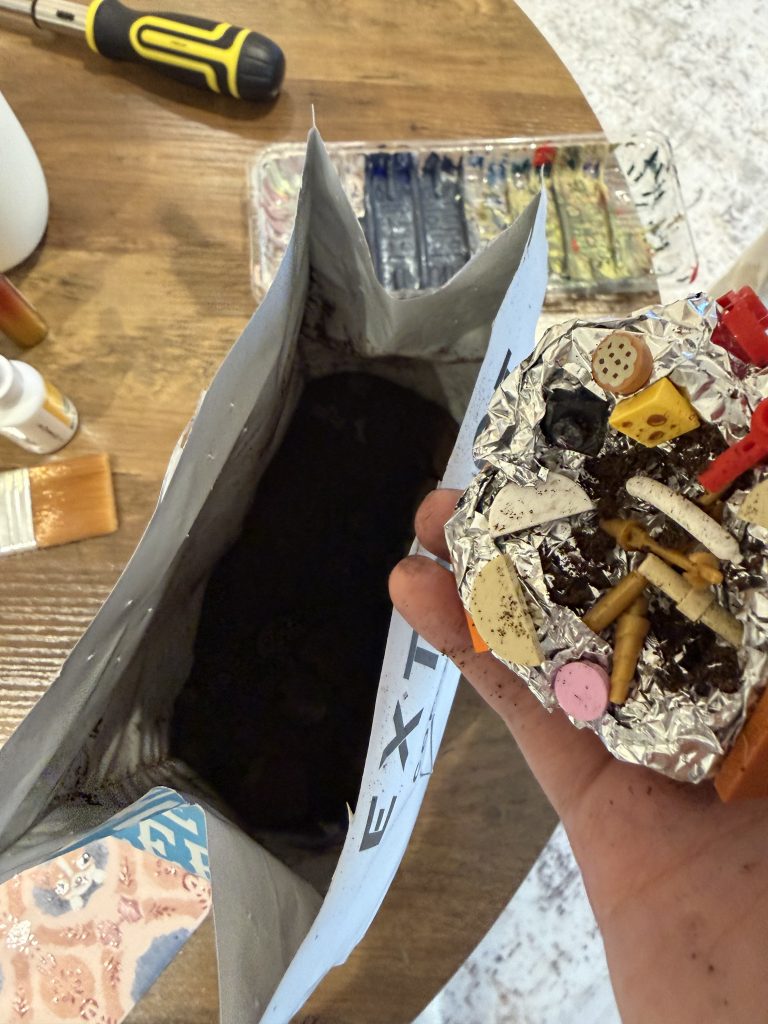
    Thinking & Material Sourcing: 30 mins
    Foil Base Shaping: 15 mins
    Searching for Lego Parts: 20 mins
    Lego Assembly & Attachment: 1 hour
    Adding Coffee Grounds: 5 mins
    Total Time: 2 Hours 10 Minutes

    2. Real Apple

    For the next iteration, I Following peers feedback, I bought real apples to replicate the form. However, instead of a natural core, I decided to build the internal skeleton using household waste—specifically dental floss and cotton swabs.
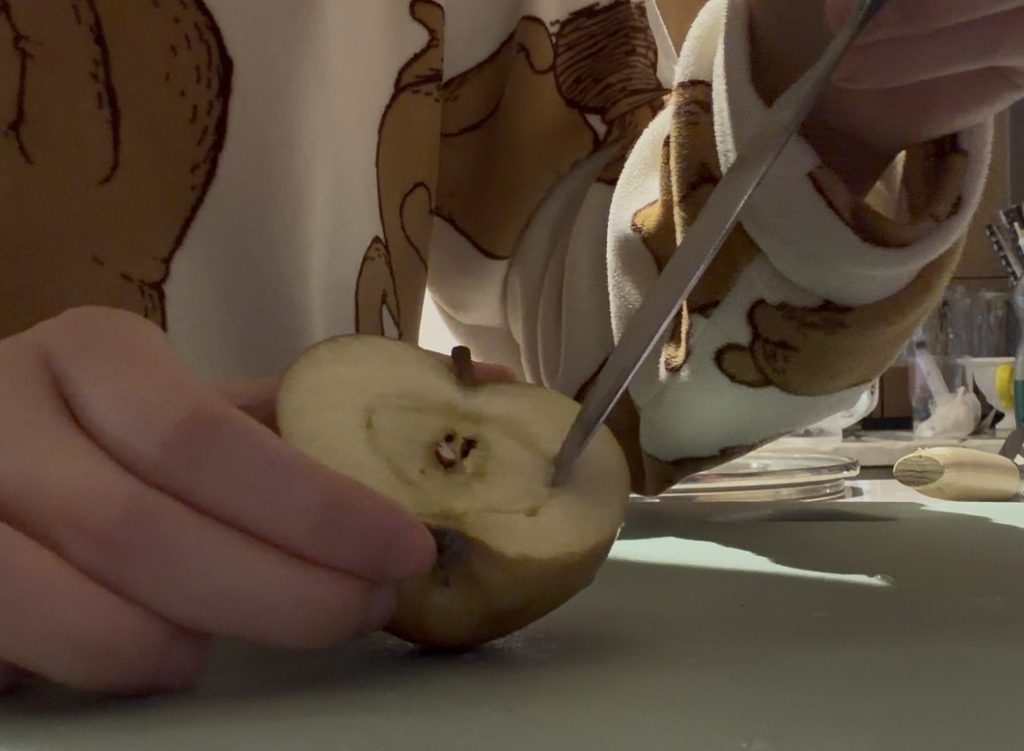
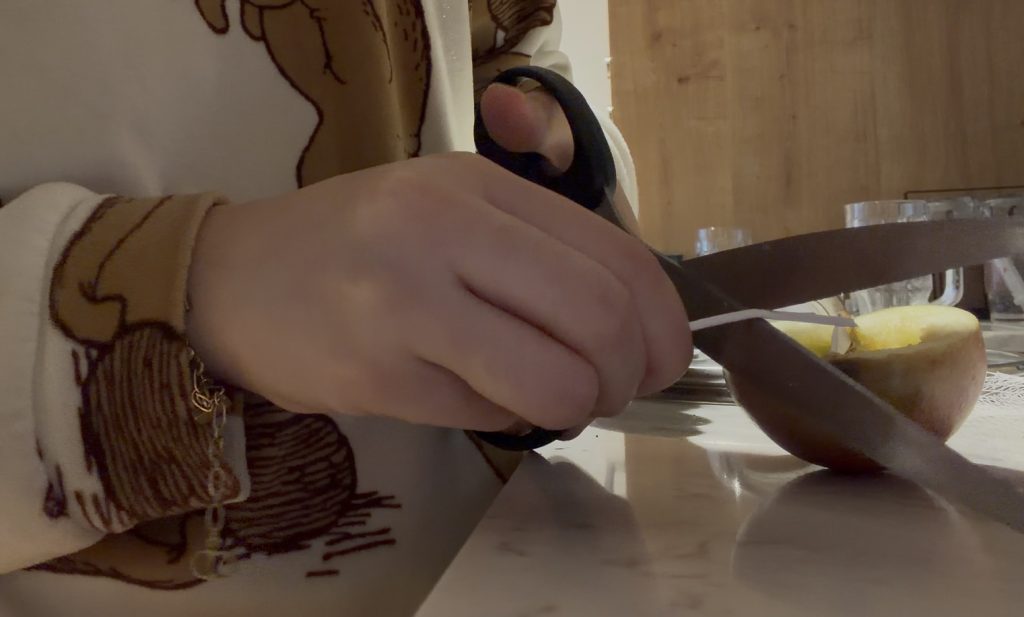
    Buying Real Apples: 40 mins
    Hollowing / Carving the Apple: 10 mins
    Sourcing & Processing Waste: 15 mins
    Assembling the Waste Skeleton: 10 mins
    Total Time: 1 Hour 15 Minutes

    3. Photographic Apple
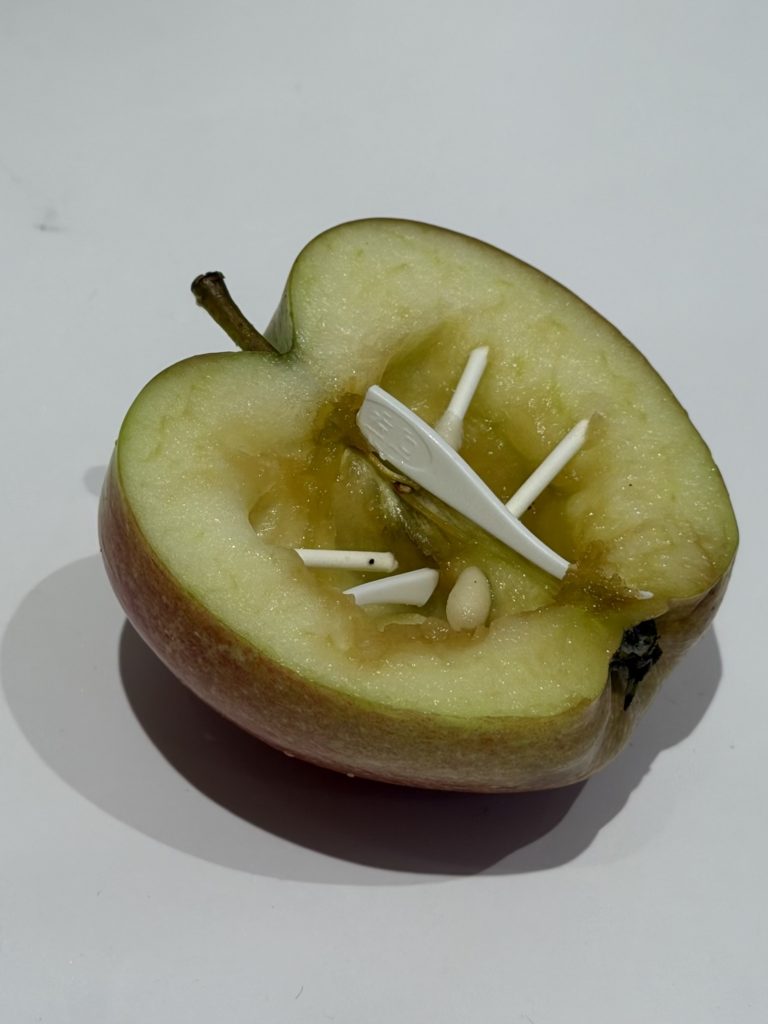
    Finding Angles & Setting Up Lighting: 5 mins
    Photography & Final Shots: 2 mins

    Total Time: 7 Minutes

    4.Scanned Apple
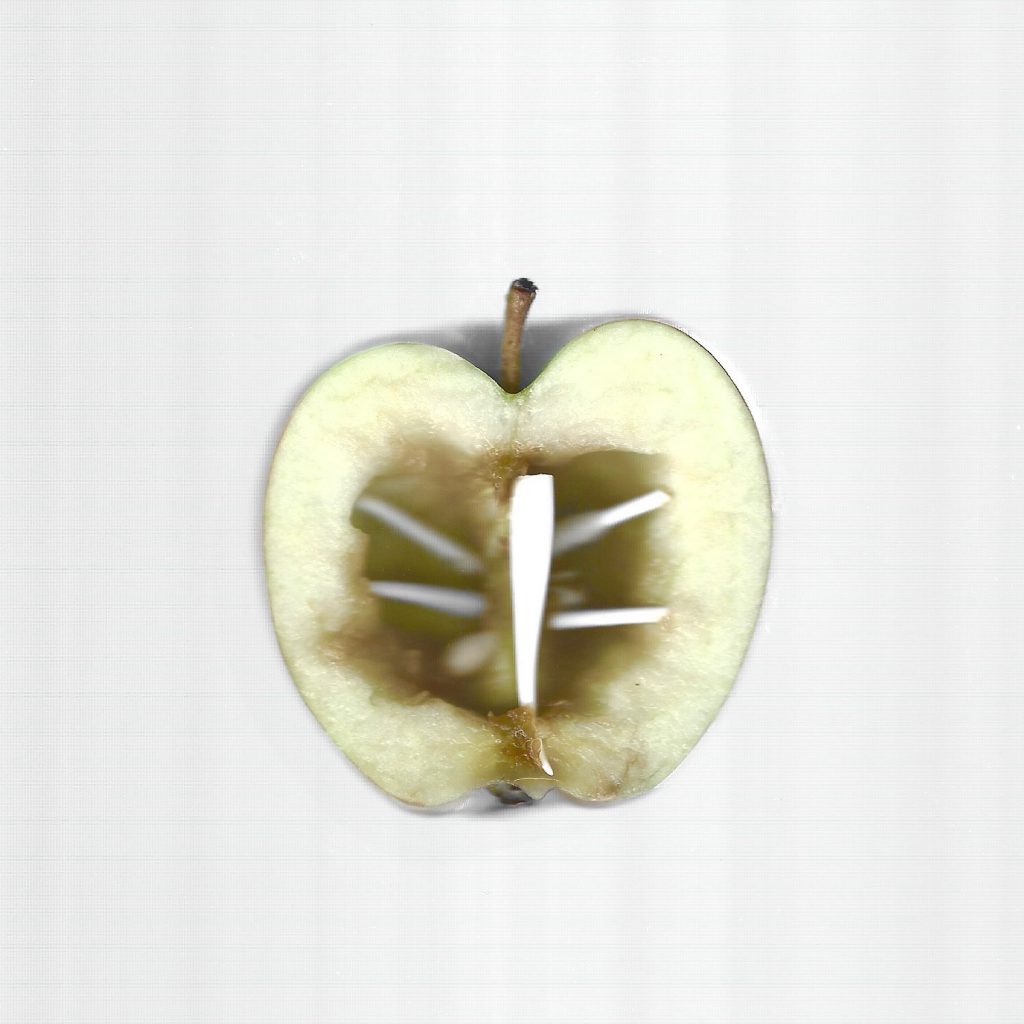
    Positioning on Scanner: 1 min
    Scanning & File Exporting: 3 mins
    Total Time: 4 Minutes

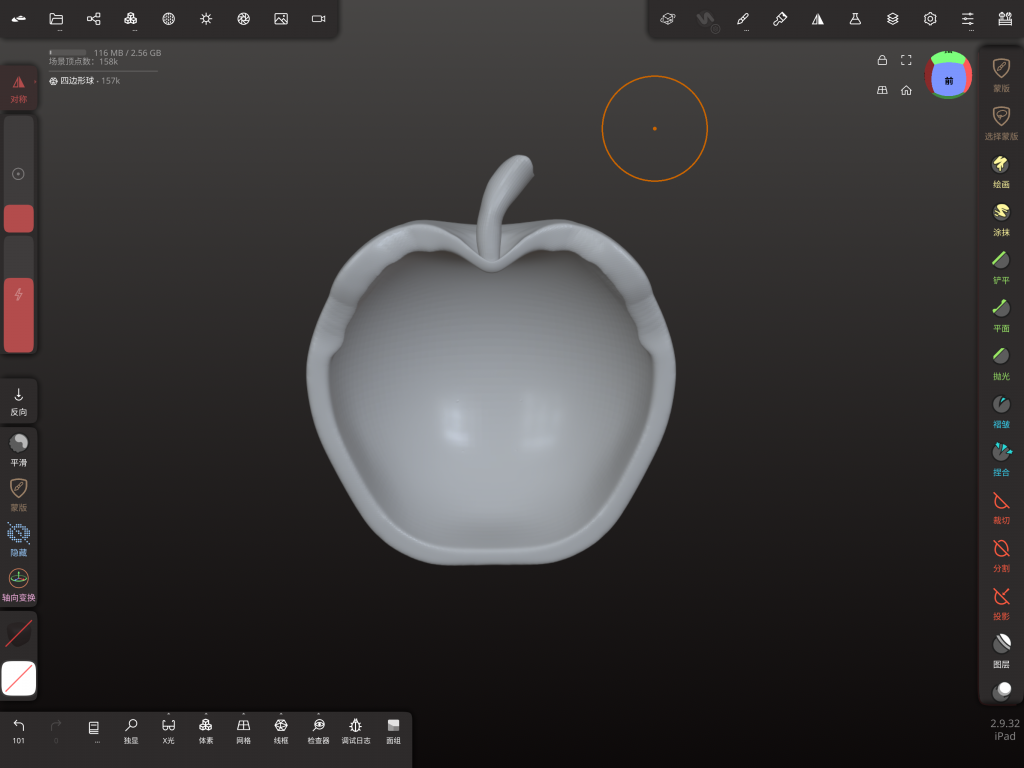
    5. 3D Modeled Apple
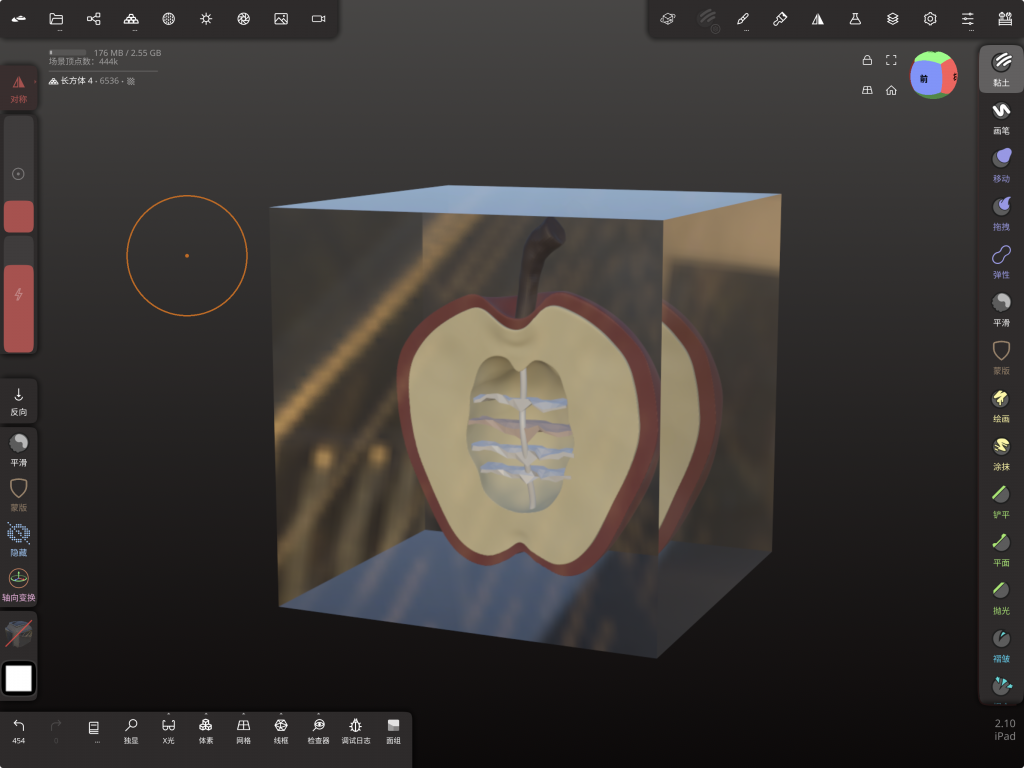
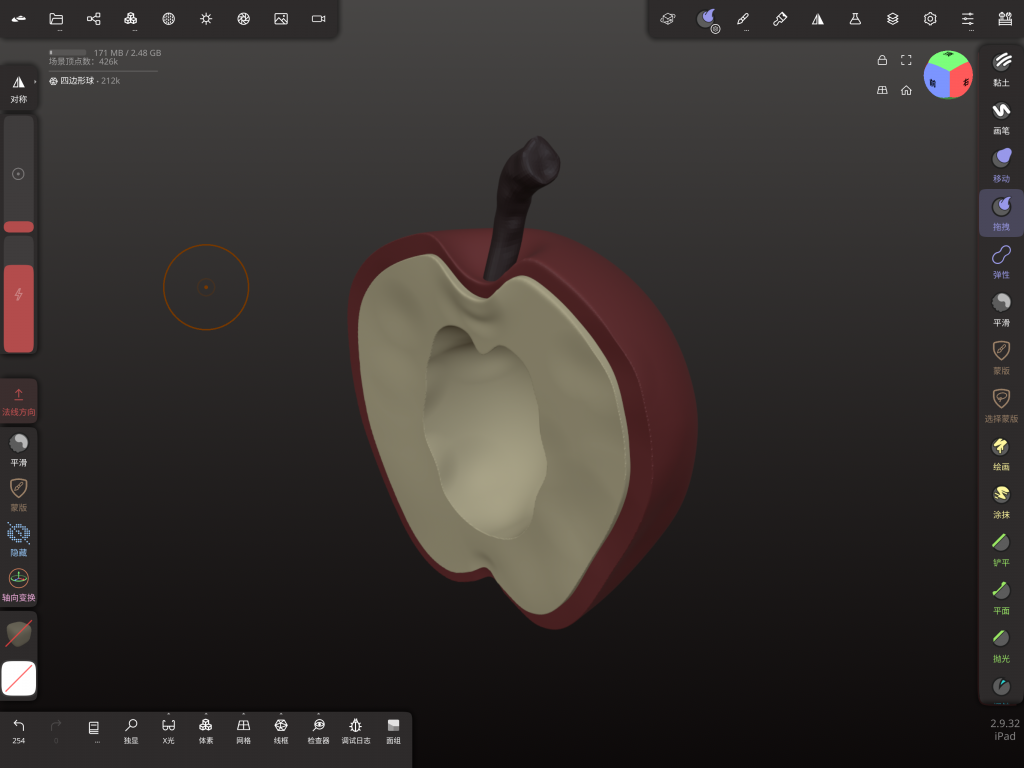
    Polygon Base Mesh: 20 mins
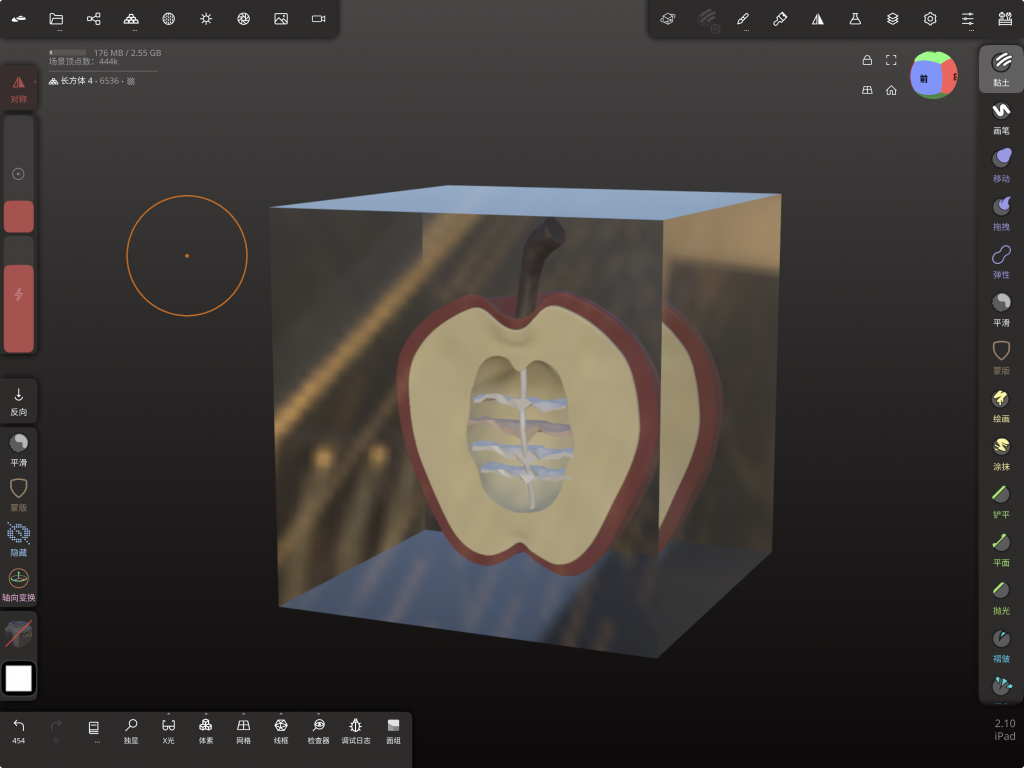
    Procedural Material & Lighting: 5 mins

    Total Time: 25 Minutes

    6. Code Apple
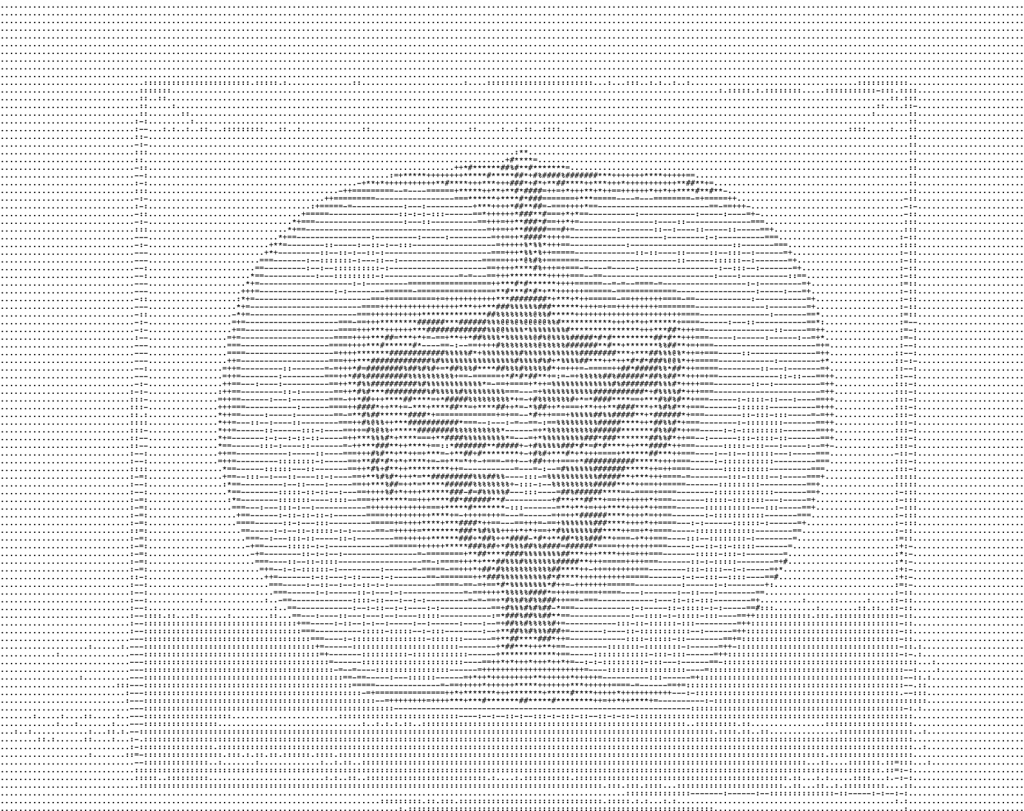
    Uploading Image to Code Generator: 2 mins
    Generating & Exporting Code File: 1 min
    Total Time: 3 Minutes

    7. Digital Collage Apple
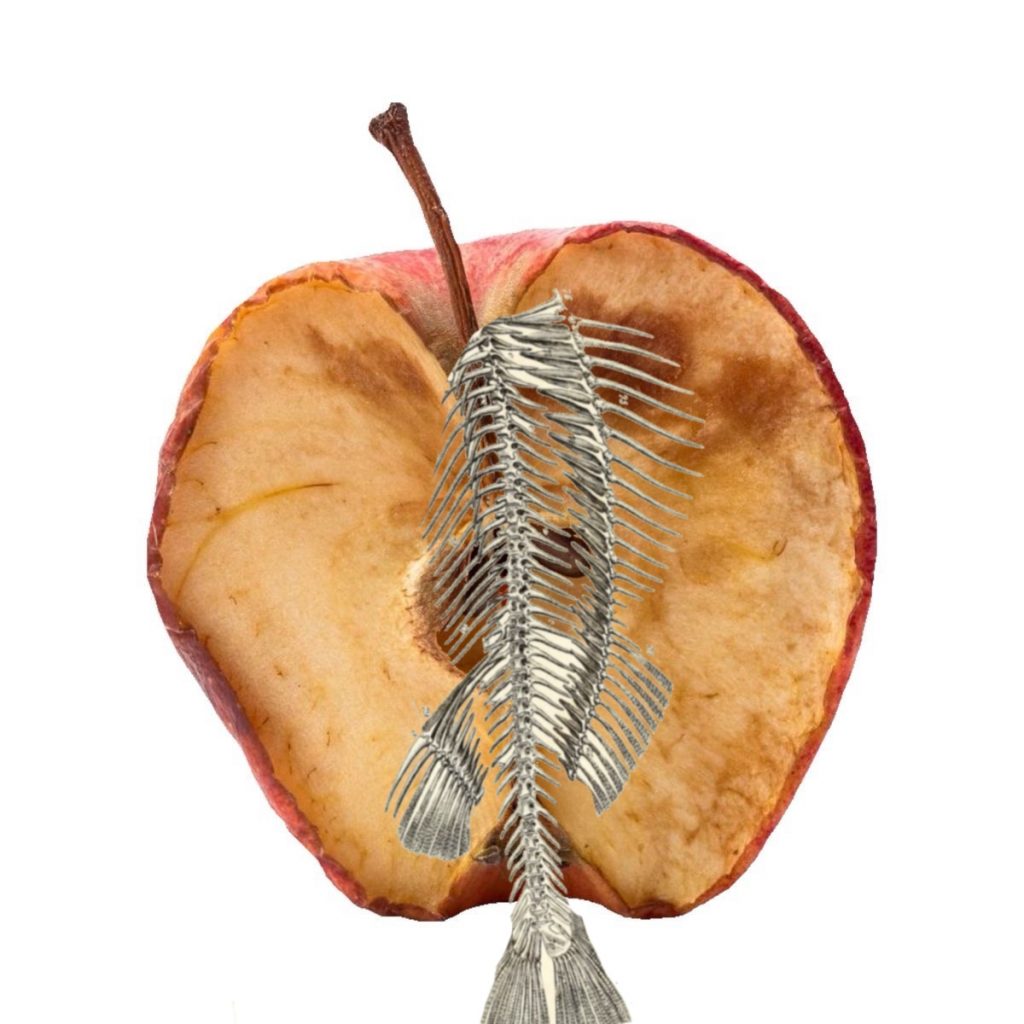
    Sourcing Digital Assets & Cutouts: 5 mins
    Digital Assembly & Layering: 5 mins
    Total Time: 10 Minutes

    8.AI Apple
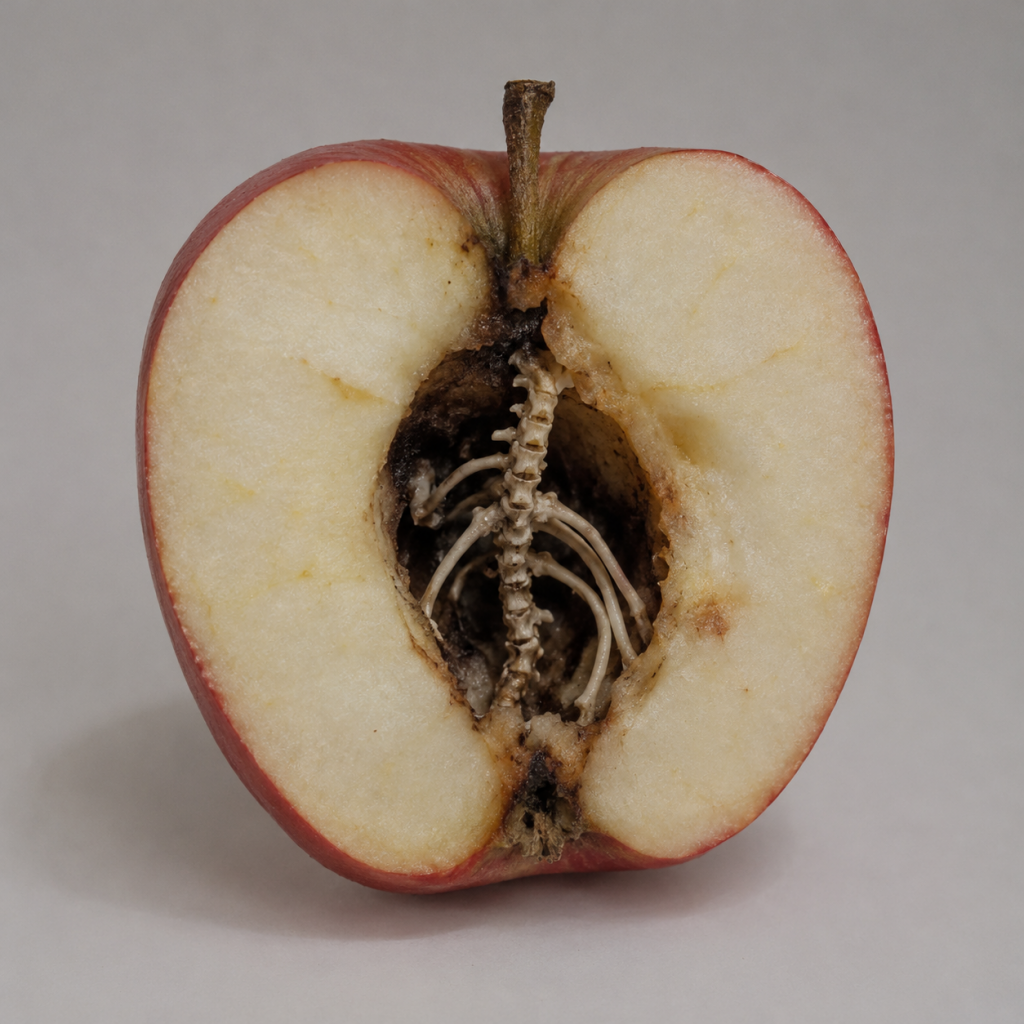
    Type in Prompt 3 minutes : Help me generate the cross-section of half an apple. The centre was hollowed out and a little black as if it was broken, and the skeleton of the creature grew out of the apple core.

    9. AI Apple (2)
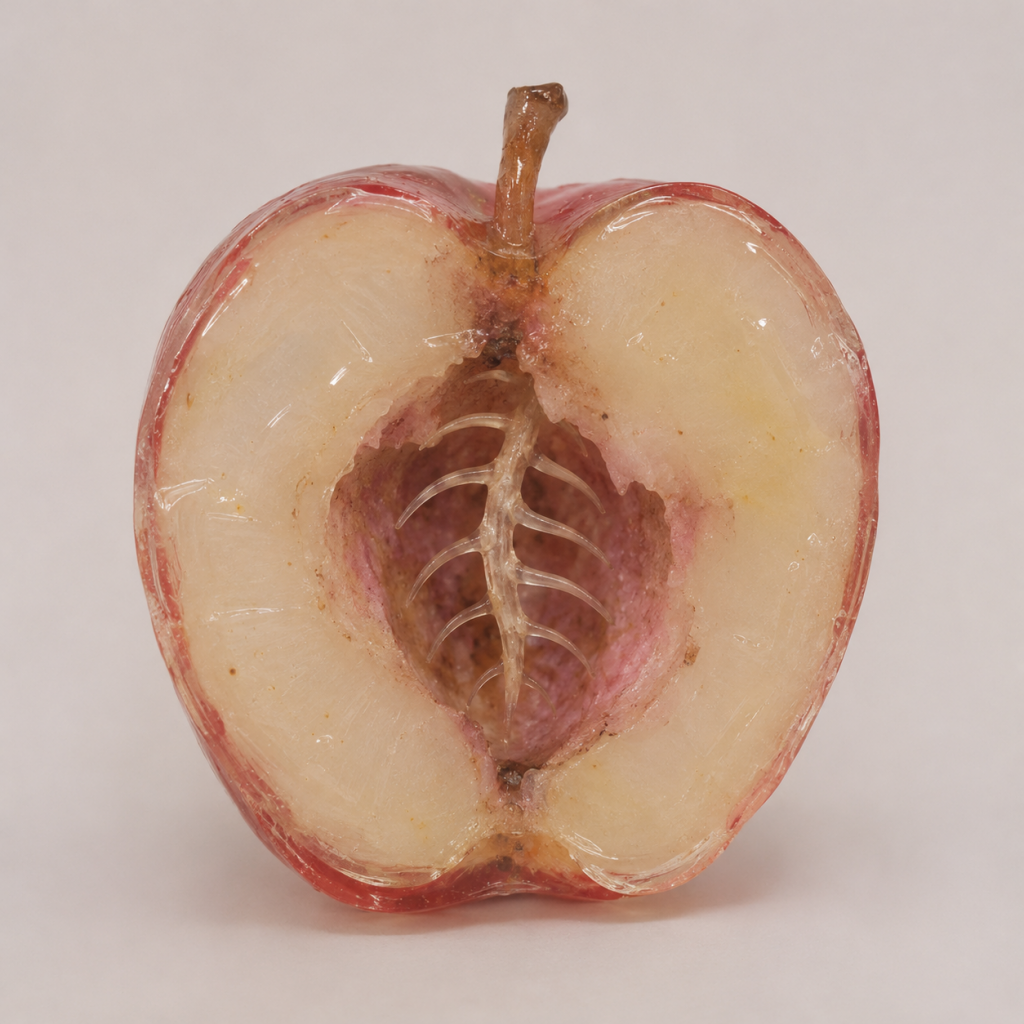
    Type in Prompt 2 minutes : You don’t need such a real apple, but an apple model made of acrylic. If you want to look like an acrylic model made of a real apple, the hole in the middle can also be dark pink, like oxidised, and the bones grown are more like fish bones, not so many joints.

    10. AI Apple (3)
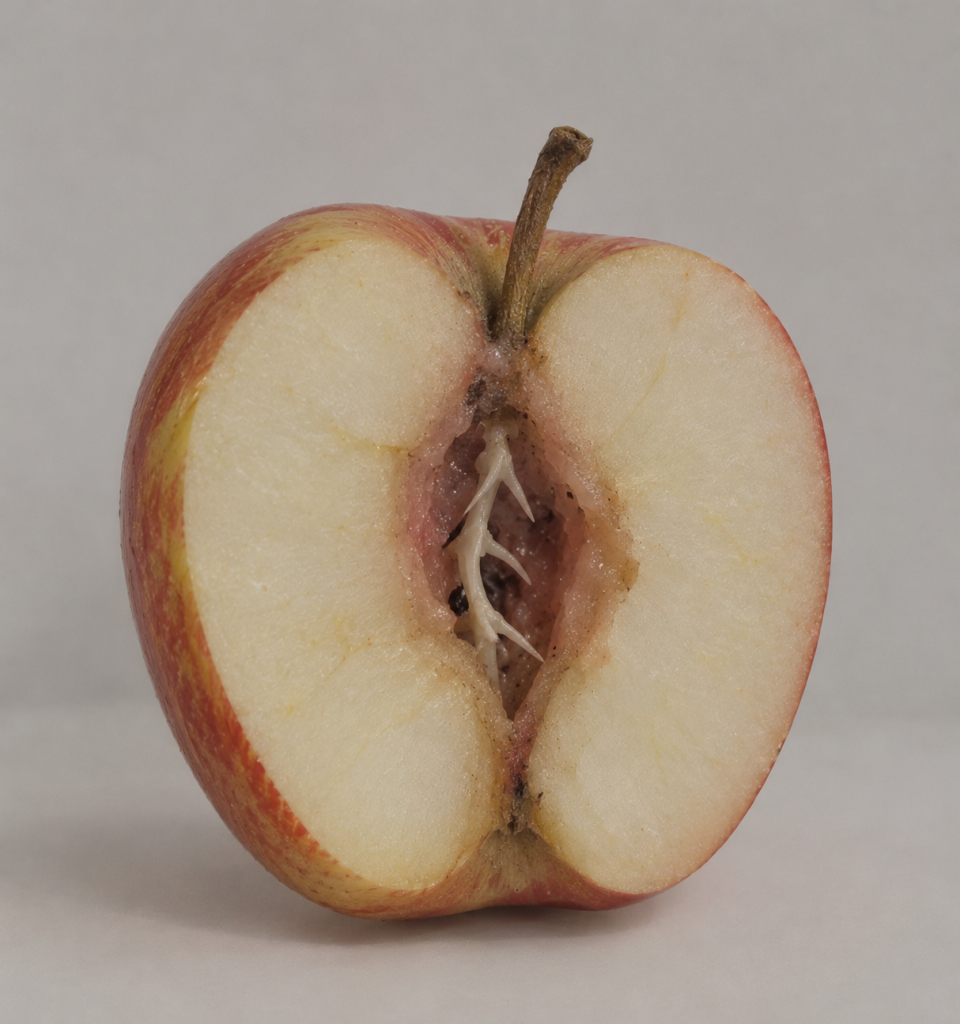
    Type in Prompt 1 minute : Don’t be so shiny. The outer skin of the apple is more like the real fruit lines. The hole in the middle can be shallower, and the bones are embedded in it to reveal part of it.

    Draft

    How does the limitations of physical manufacturing expose the boundary between tactile reality and digital perfection?

    When we observe things in the real world, we don’t just look at them with our eyes, but also perceive them through touch, smell, etc.

    Through the experiment of copying works of art, I found that physical materials always have certain limitations. Just like when I use air-dry clay, I need to spend time waiting for it to dry. When it is not easy to shape, I will find items that can support it. The whiteness of the resin oil and the drip glue that can’t be dried will always have errors one by one. During this period, it takes a lot of time to experiment and make mistakes.

    But when I use 3D modelling, I can undo the wrong steps with just a finger. As long as I am familiar with the toolbar, I can quickly copy many models. And AI Apple only needs a single prompt to quickly generate an art replica.

    But tactile reality is defined by these physical defects, and we perceive the real world through these unpredictable resistances. Digital perfection is more like an illusion. It is through this erasing the limitations of physical materials in the physical world that it provides instant and flawless output.

    Therefore, this experiment also exposes the boundary between the two. There is an essential difference between virtual and reality. Touch reality depends on physical resistance, while digital perfection can only exist when physical resistance is taken away.
  • Iterating 1

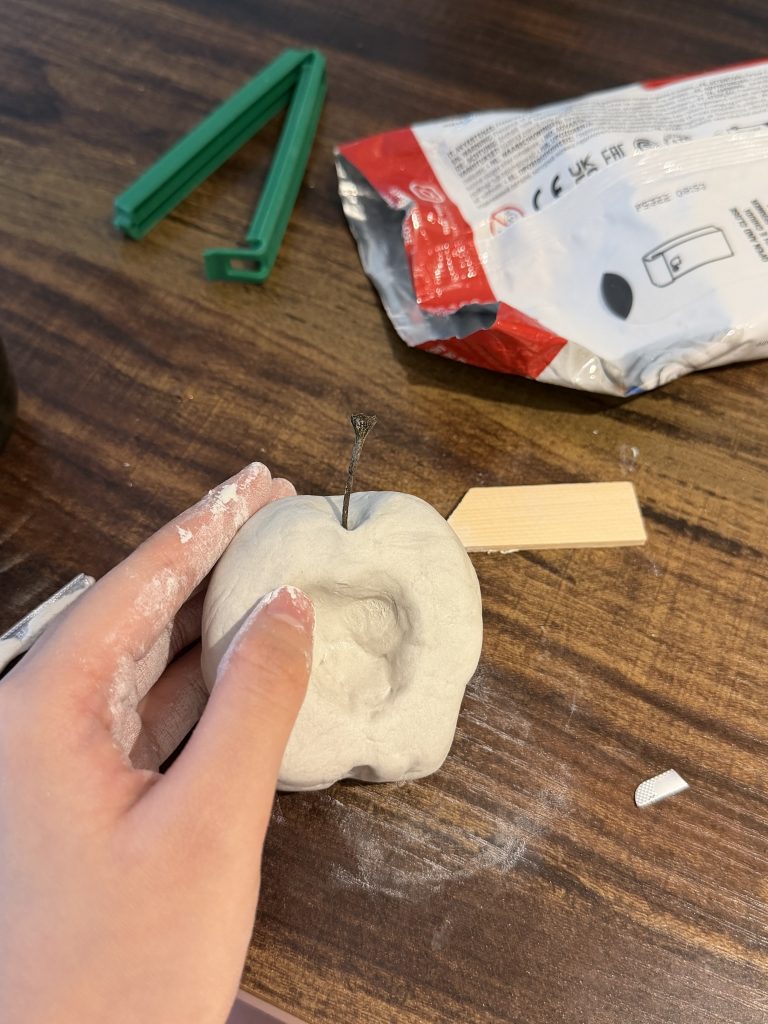
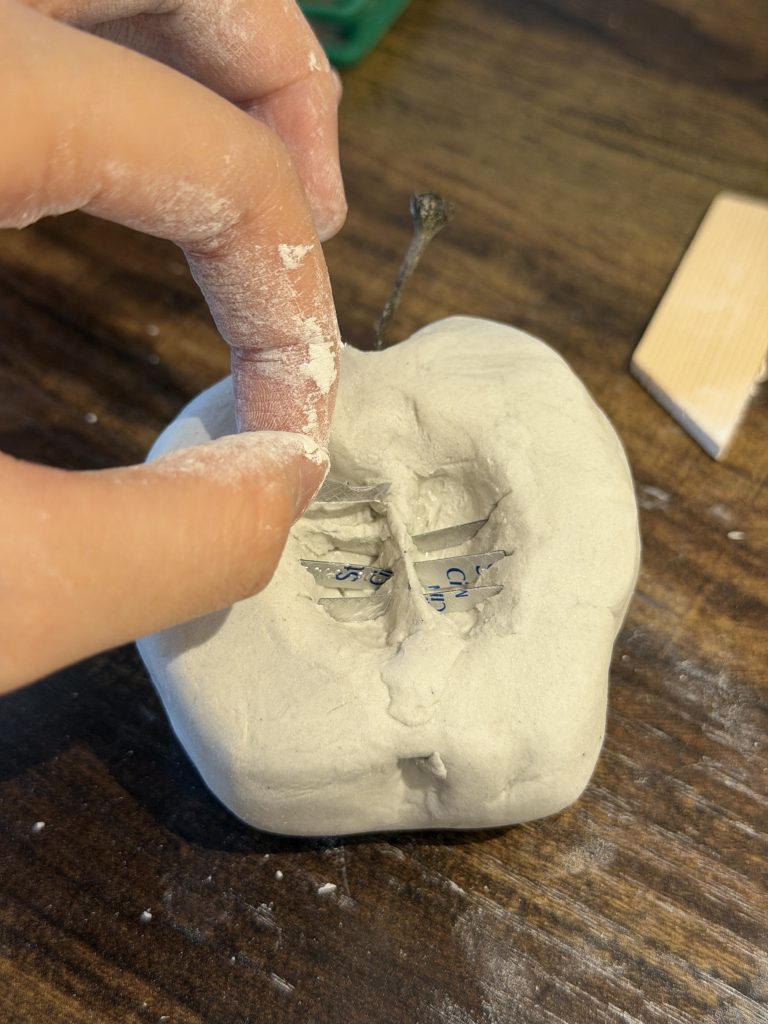
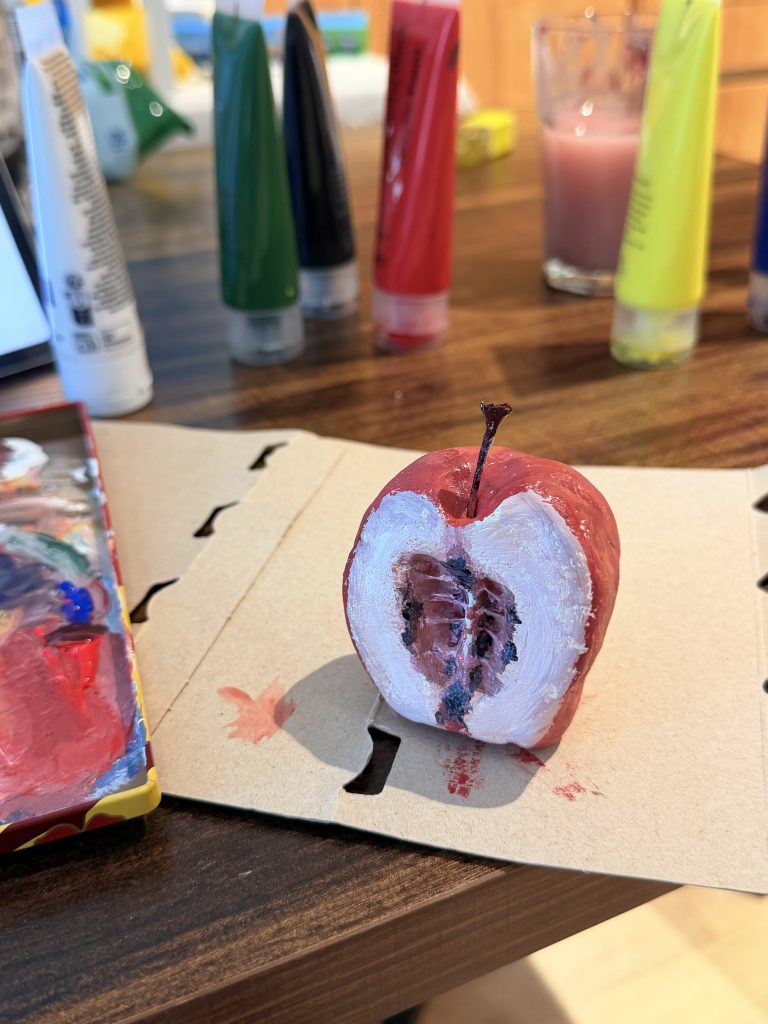
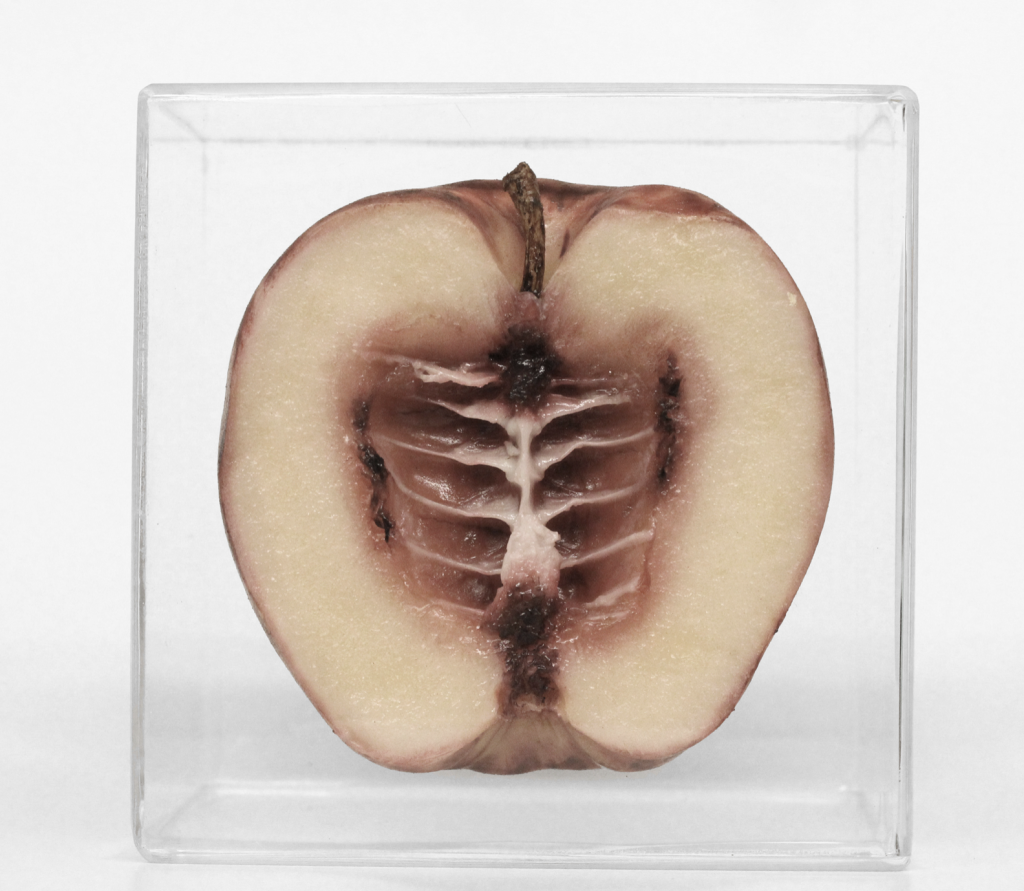
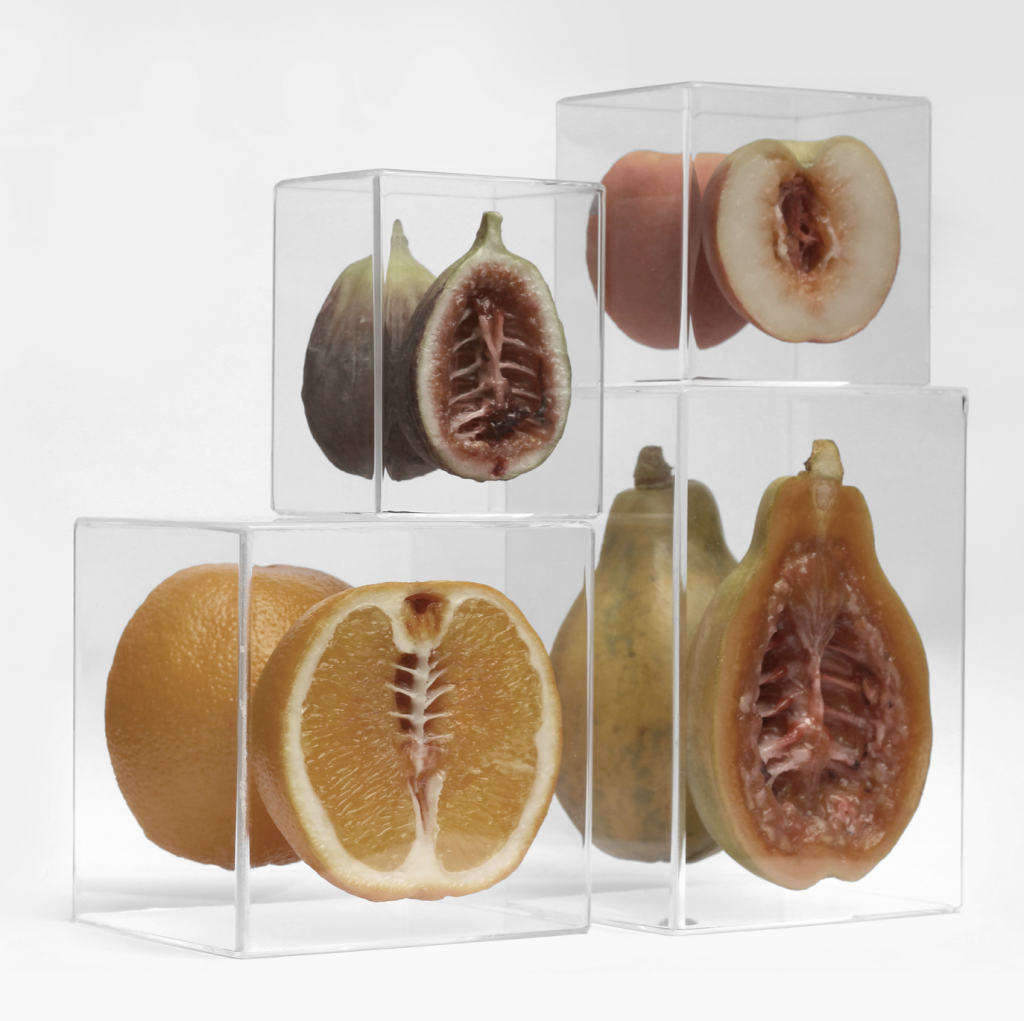
    For this brief, I explored physical hand-sculpting using air-dry clay to remake Monica Piloni’s Séries Hybris. Her work investigates the alienating tension of everyday commodities by embedding animal anatomical structures—such as spines and ribs—inside the cross-sections of everyday fruits. While Piloni’s original works are crafted from vinyl and acrylic, I opted for clay because it is accessible, intuitive, and easy to handle for rapid prototyping.

    Making Process:

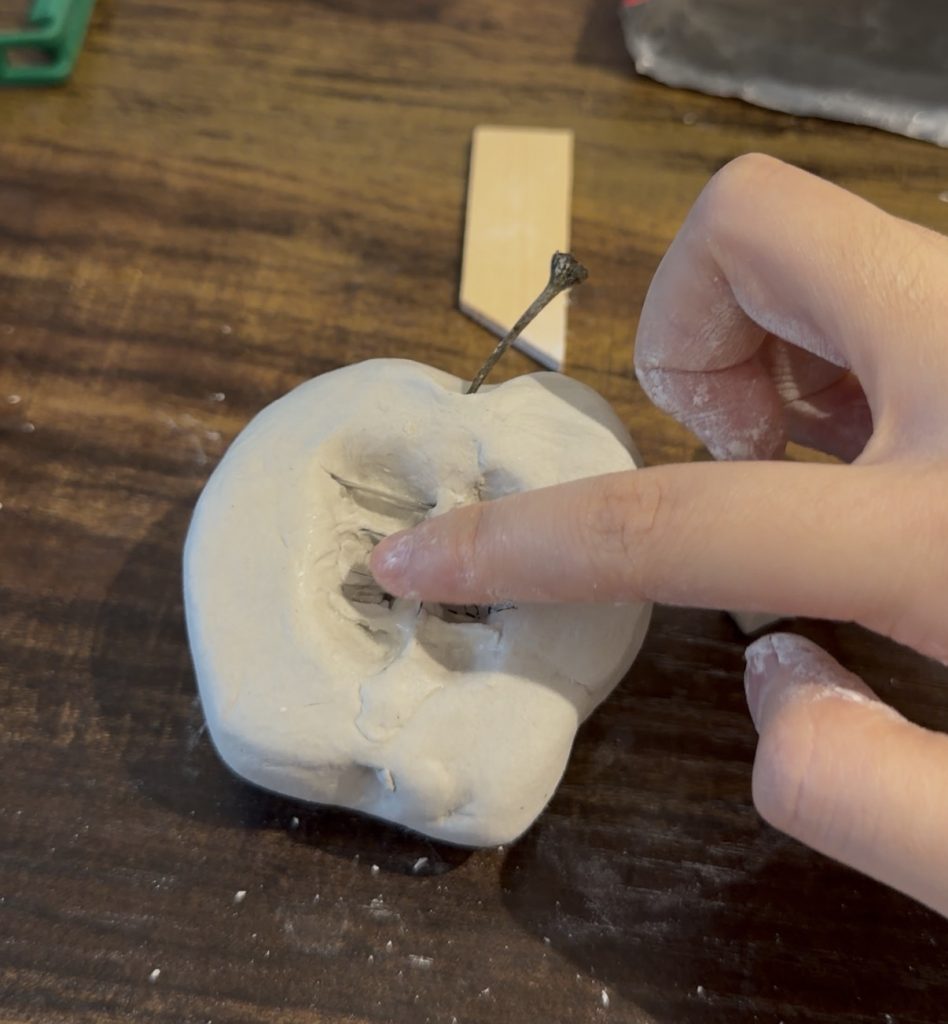
    1. Forming the Base: Sculpted the half-apple base using stone-plastic air-dry clay, hollowing out the central cavity for the anatomical structure. 
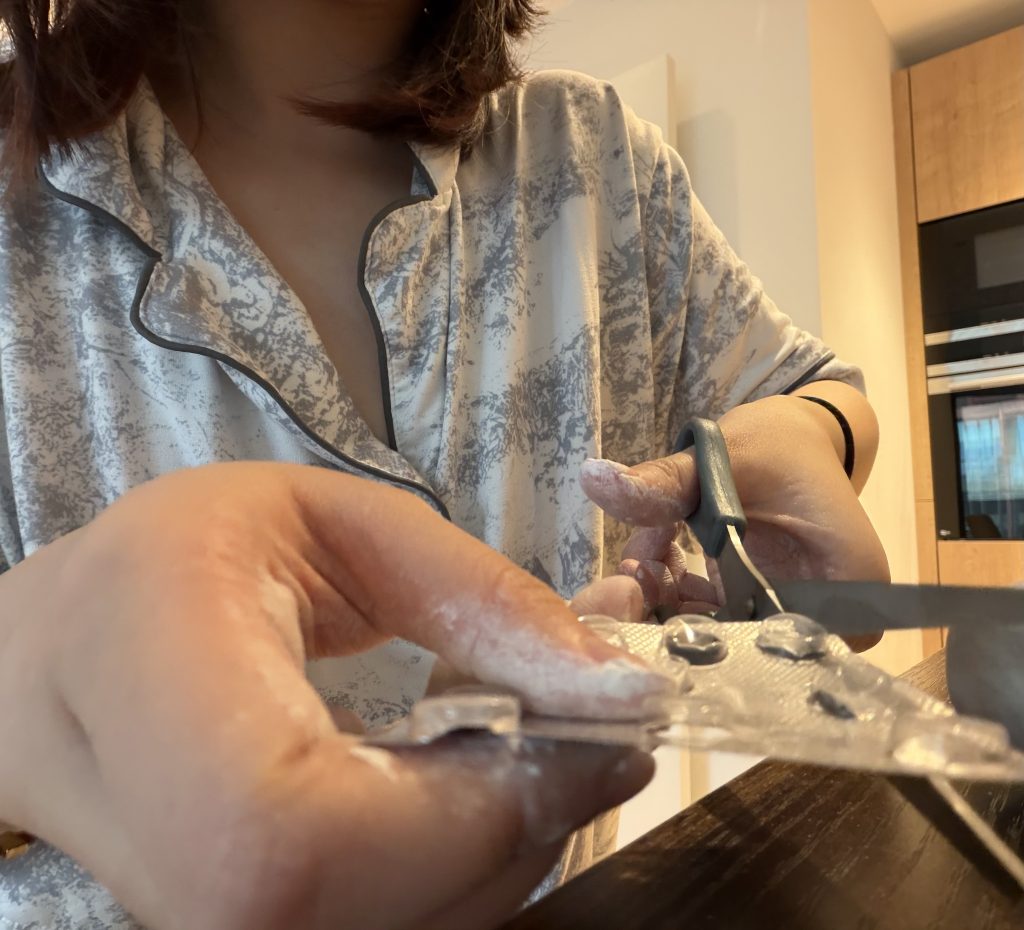
    2. Structuring the Skeleton: Cut up empty blister foil packaging to serve as an internal supportive armature, embedding it within the clay cavity and covering it with a fresh layer of clay to build a 3D bone/rib structure. 
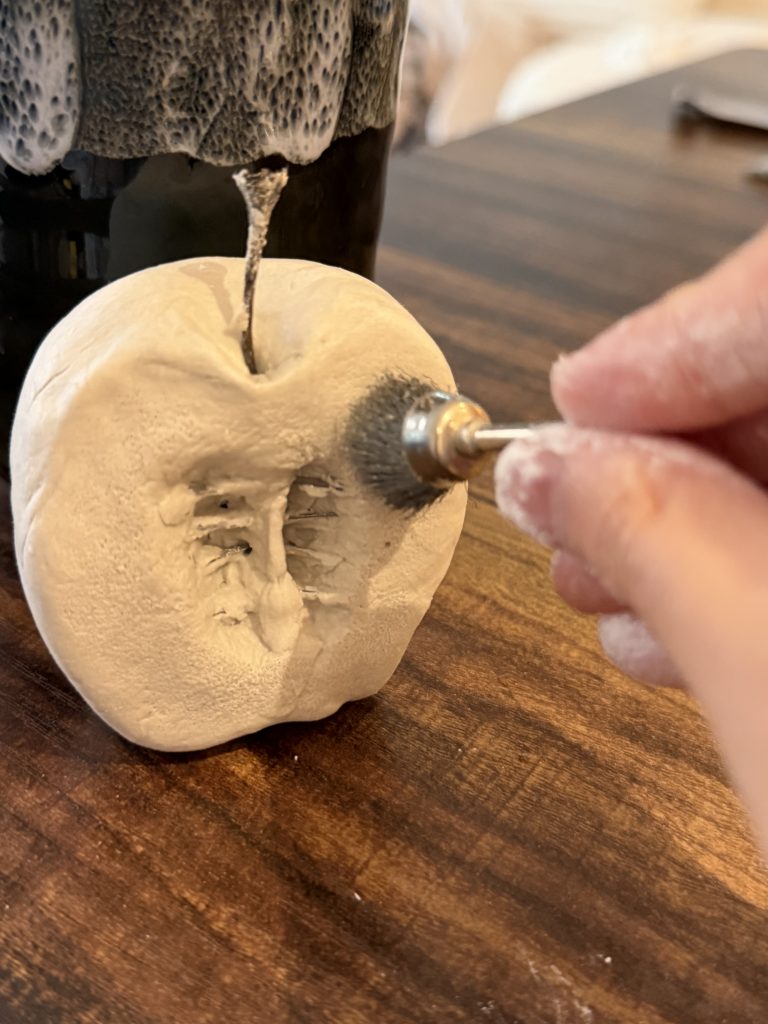
    3. Texturing the Surface: Used a miniature wire brush tool to stipple and carve details into the cross-section, capturing the organic, fibrous texture of the fruit pulp. 

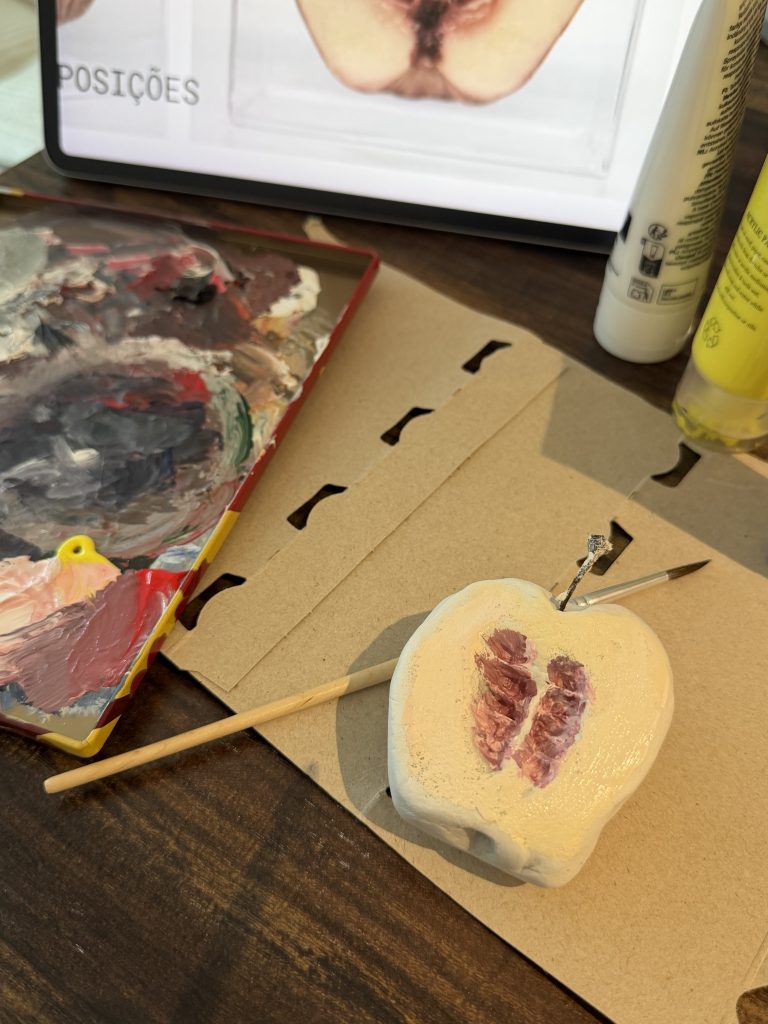
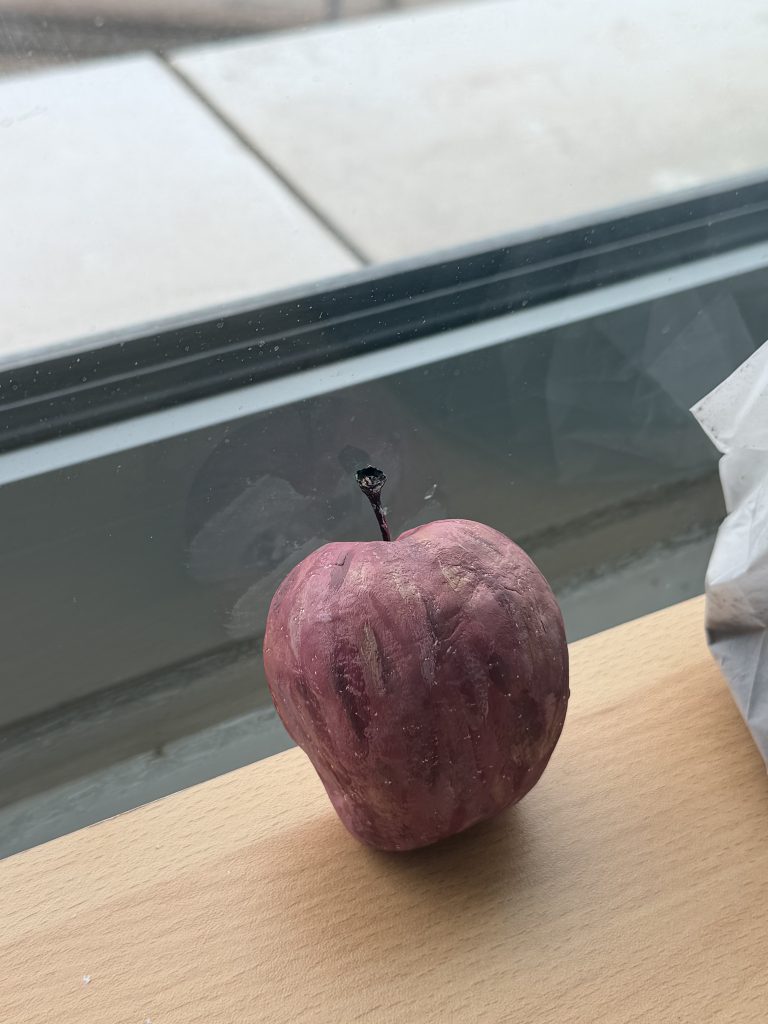
    Once the sculpted clay model was fully air-dried, I applied acrylic paint to render the organic tones and surface details, followed by a final drying stage to lock in the finish.

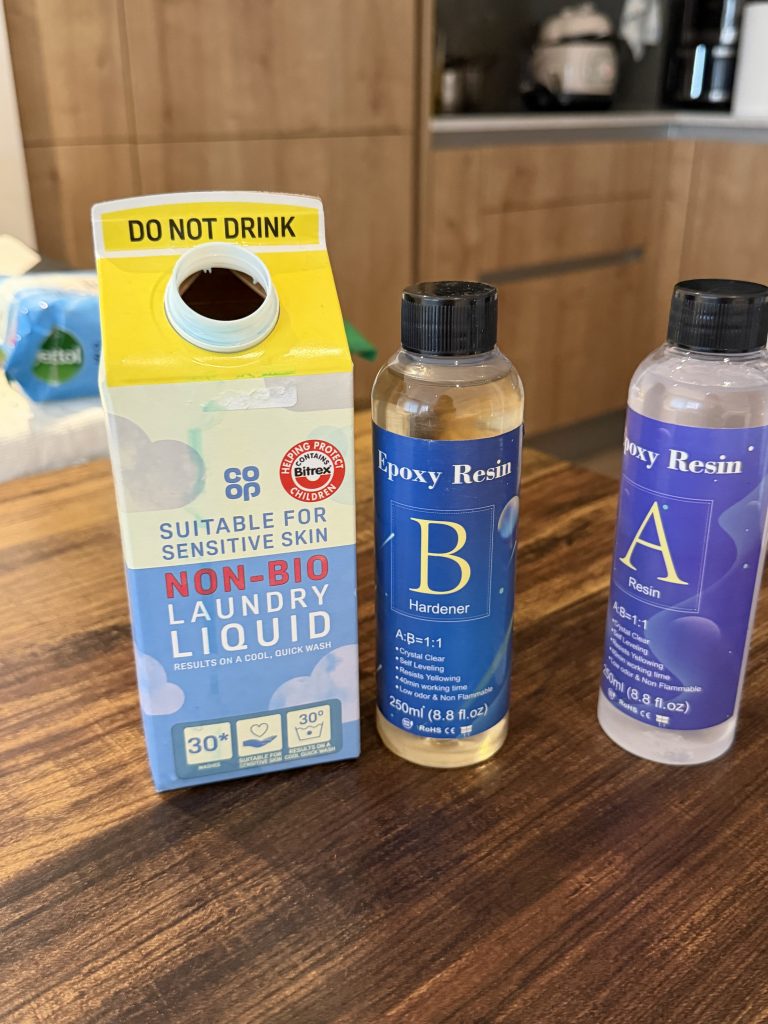
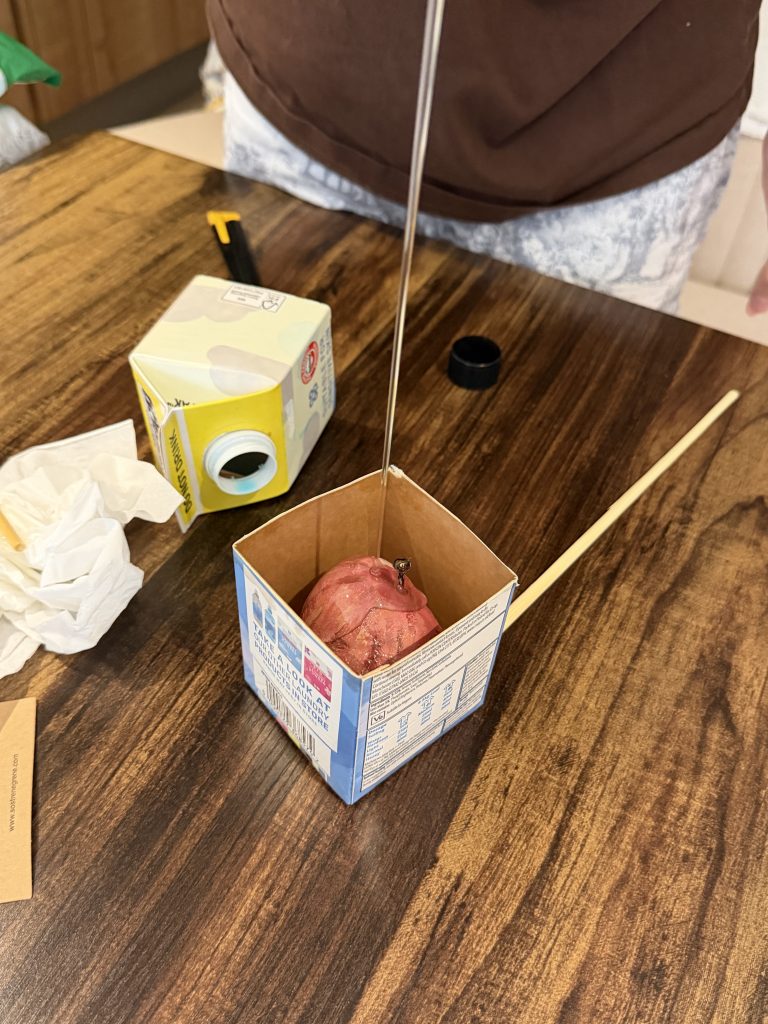
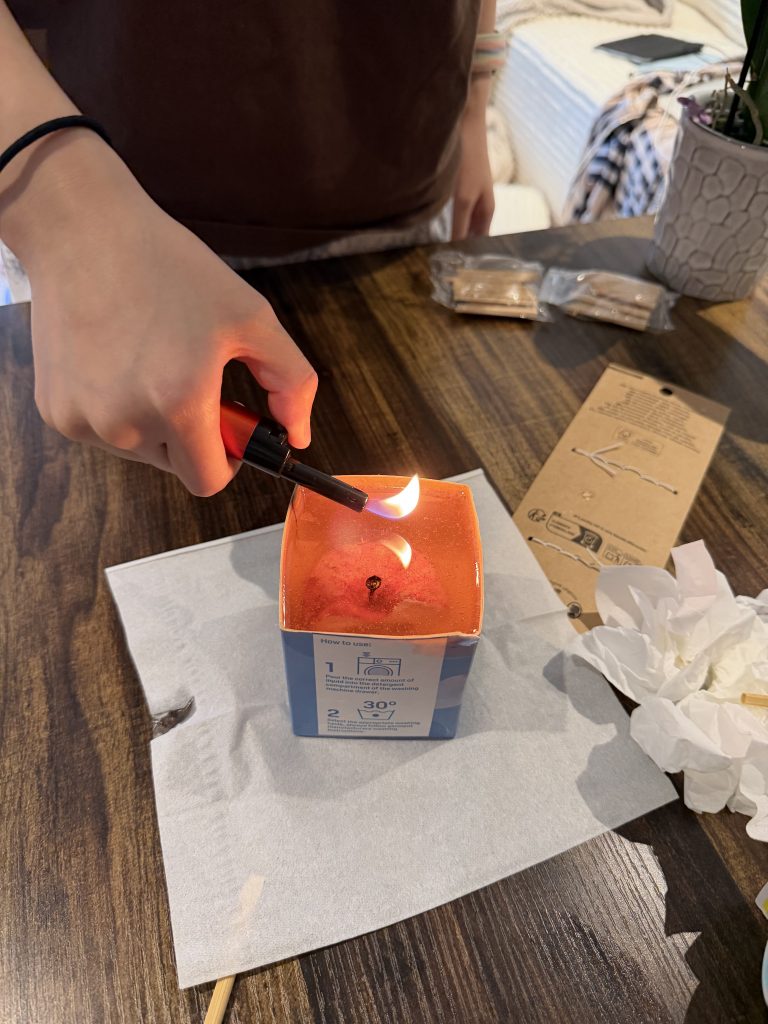
    To replicate the transparent acrylic cube of the original work, I cut an empty laundry detergent bottle into a square shape to serve as a makeshift mold. After placing the painted clay sculpture inside, I poured mixed AB resin over it and used a flame to remove air bubbles from the surface, sealing the sculpture within a clear block.

    Draft

    The reproduction artwork I chose is “Séries Hybris” by Monica Piloni. Although Piloni’s original work uses Vinyl and Acrylic to achieve a cold and ultra-realistic effect, I deliberately chose clay and daily waste as easy-to-use media for quick physical prototype creation.

    The handmade process reveals the distinct material limitations, and the soft clay is difficult to maintain structural accuracy, forcing me to rely on the temporary cut plate as an internal bone support. And it is difficult to restore the texture characteristics of real fruits by hand colouring. This raises a key question. How does the limitations of physical manufacturing expose the boundary between tactile reality and digital perfection?

    In order to further explore this point, the physical sculpture will be used as a tactile basis. In the next experiment, I am going to transform this prototype into 3D digital modelling. Entering the virtual space allows me to get rid of the limitations of physical materials and regain control of fine micro-details and complex geometric forms.

  • Written Response

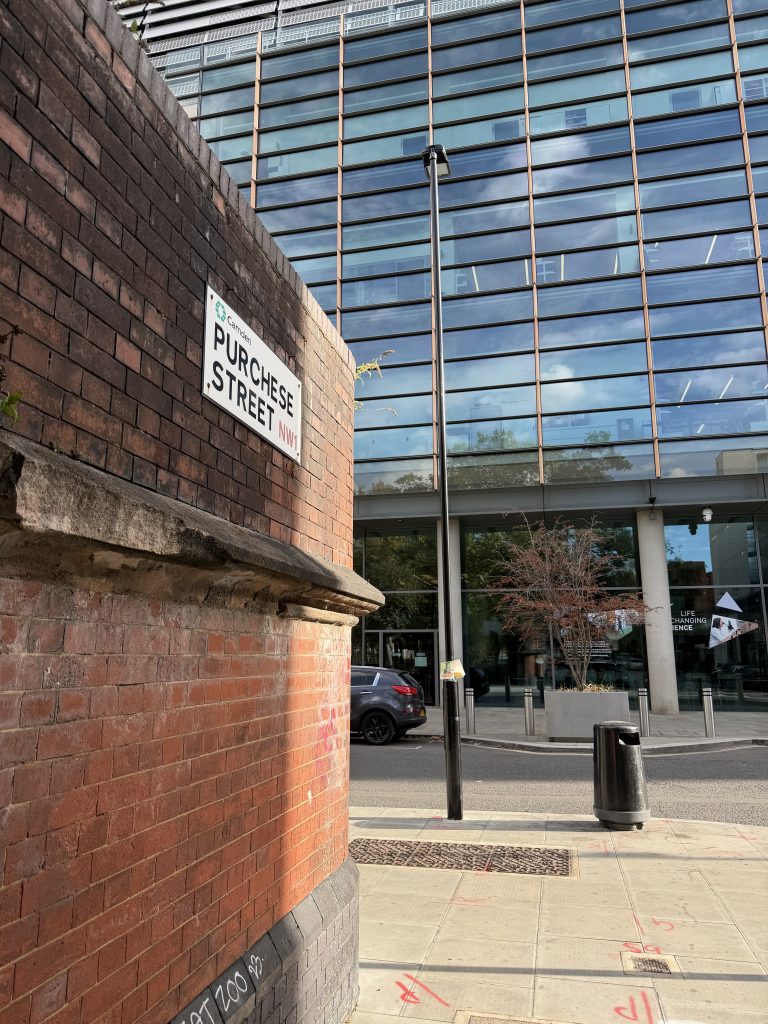
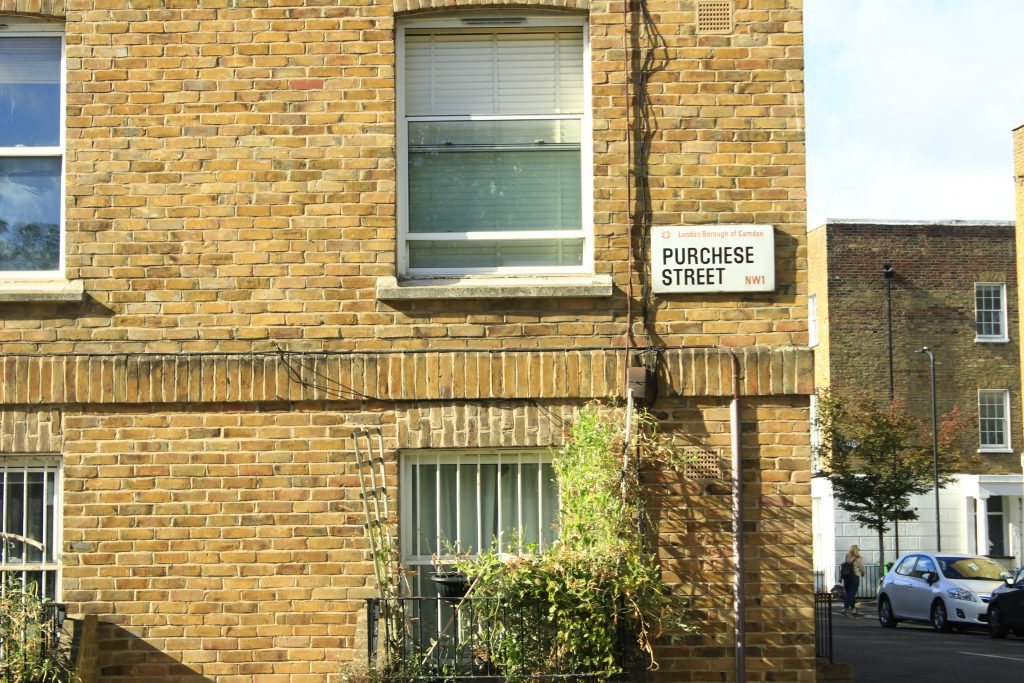
    When I was walking from King’s Cross to another place, I suddenly noticed that something had changed. The brand-new buildings and clean pavements around me had disappeared. Instead, there were dilapidated residential buildings and rubbish scattered across the ground. This was Purchese Street.

    I chose this street as my investigation area because the contrast was so striking that I wanted to understand it more deeply. I tried three methods: knolling, mapping and photography. With my tutor’s suggestion, I also combined scanning with knolling. During my research, I began to focus on the everyday waste we usually ignore, which reminded me of Georges Perec’s writing about everyday spaces. Rather than treating ordinary things as insignificant, Perec encourages us to look again at what we often overlook (Perec, 1974). When I collected discarded wrappers and cans, I noticed that their logos, price information and materials carried traces of commercial and social life. This ordinary street became more than just a place; it was a space shaped by consumption, habits and everyday decisions.
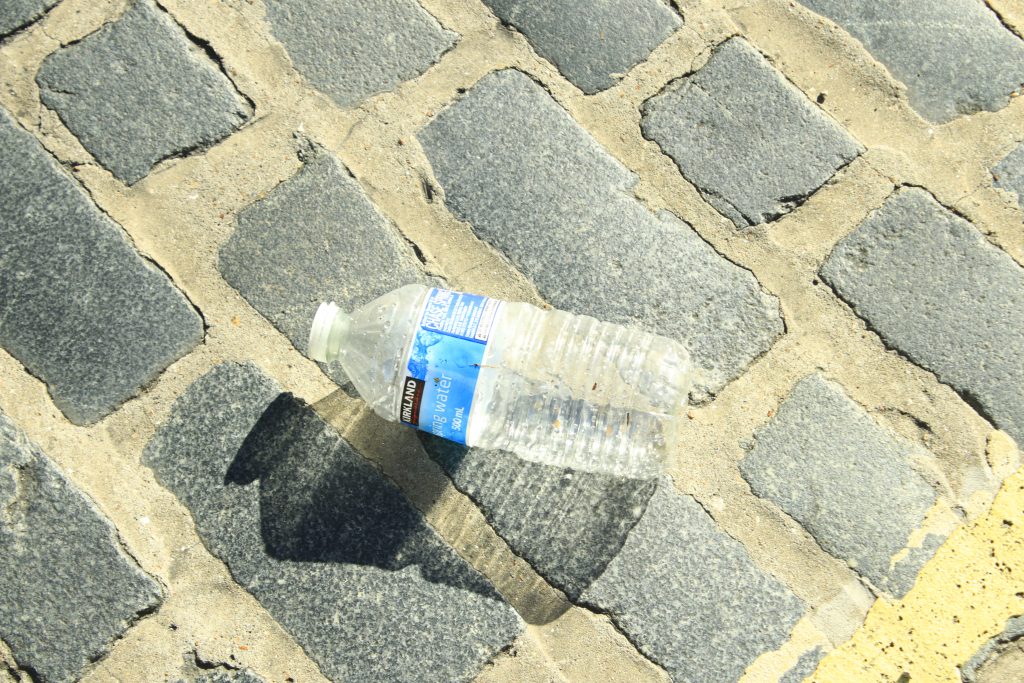
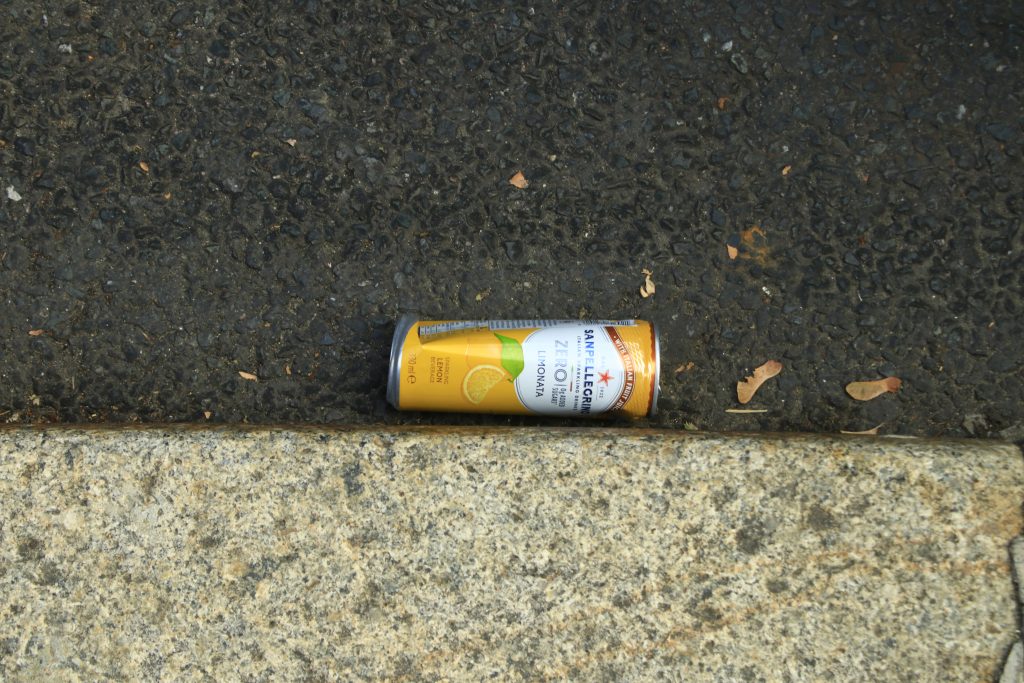
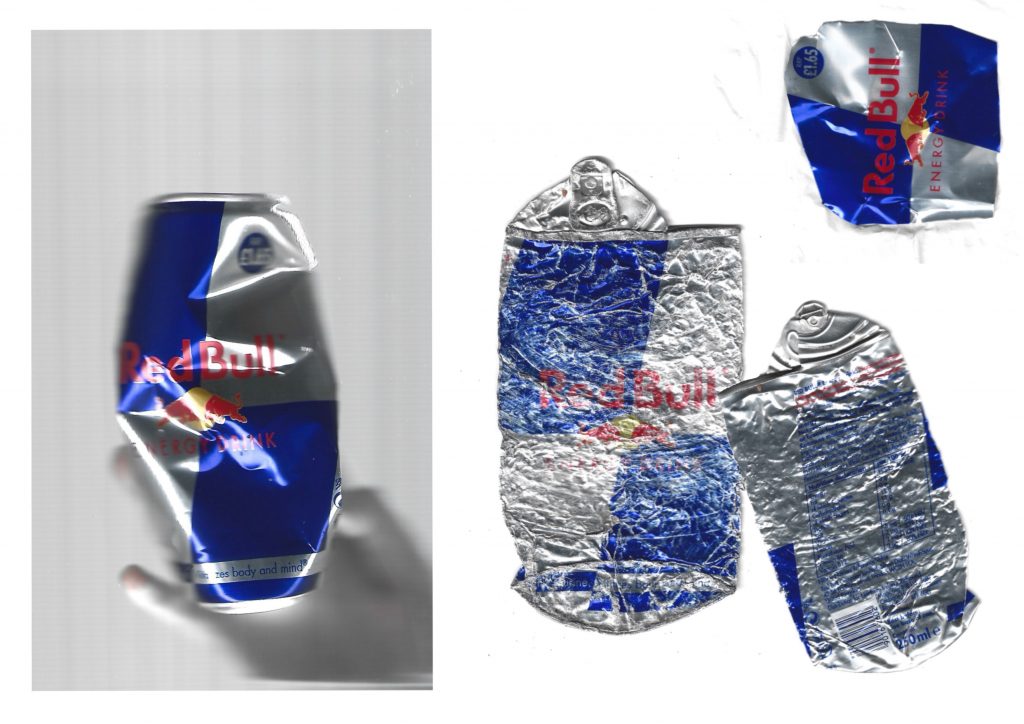
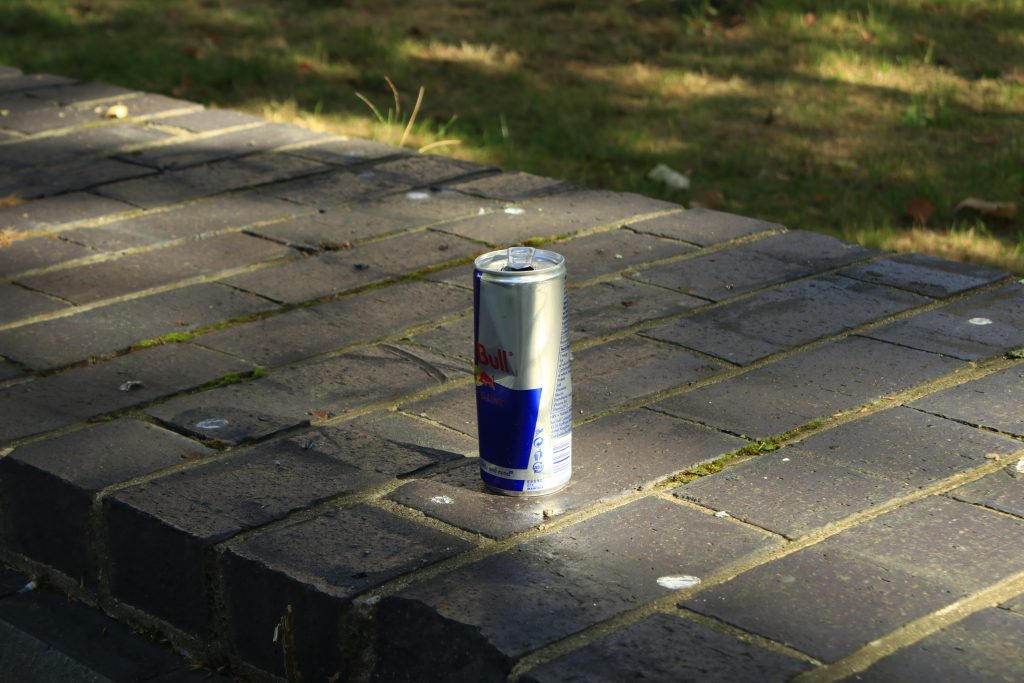
    My process also relates to Agnès Varda’s documentary The Gleaners and I (2000), which explores the collection and recovery of discarded objects. Collecting waste from Purchese Street became a form of gleaning for me. I brought these objects home and scanned and sorted them. Unlike photography, which records objects within their surroundings, scanning allowed me to examine the packaging more closely. For example, I found two Red Bull cans in very different conditions, suggesting how differently they had weathered on the street. This shift from observing the environment to examining individual objects made me realise that research depends not only on what I observe, but also on how I choose to observe it.

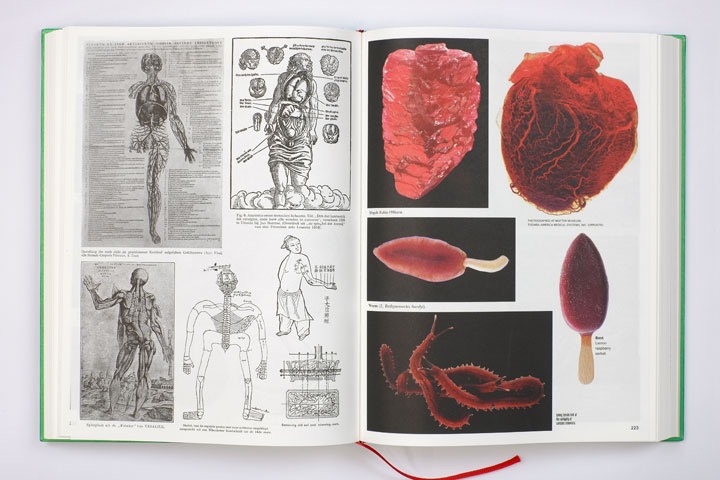
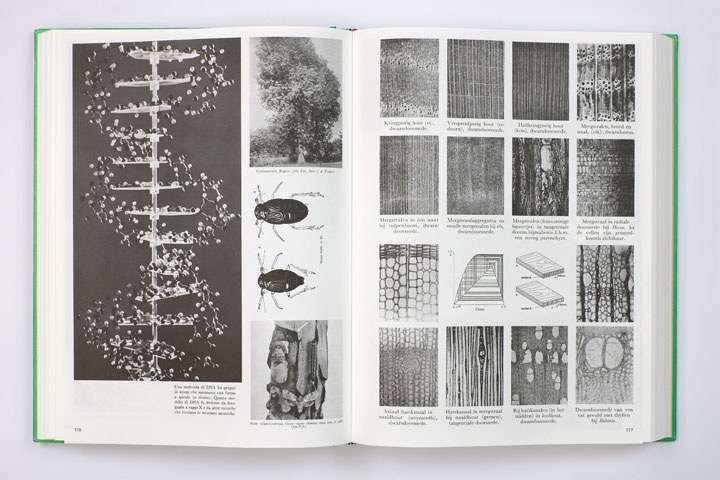
    Batia Suter’s Parallel Encyclopedia 2 inspired me to think about relationships between images. Her arrangements encouraged me to rethink knolling, not simply as sorting objects by type, but as connecting them through price, typography, colour or material to create new visual narratives.

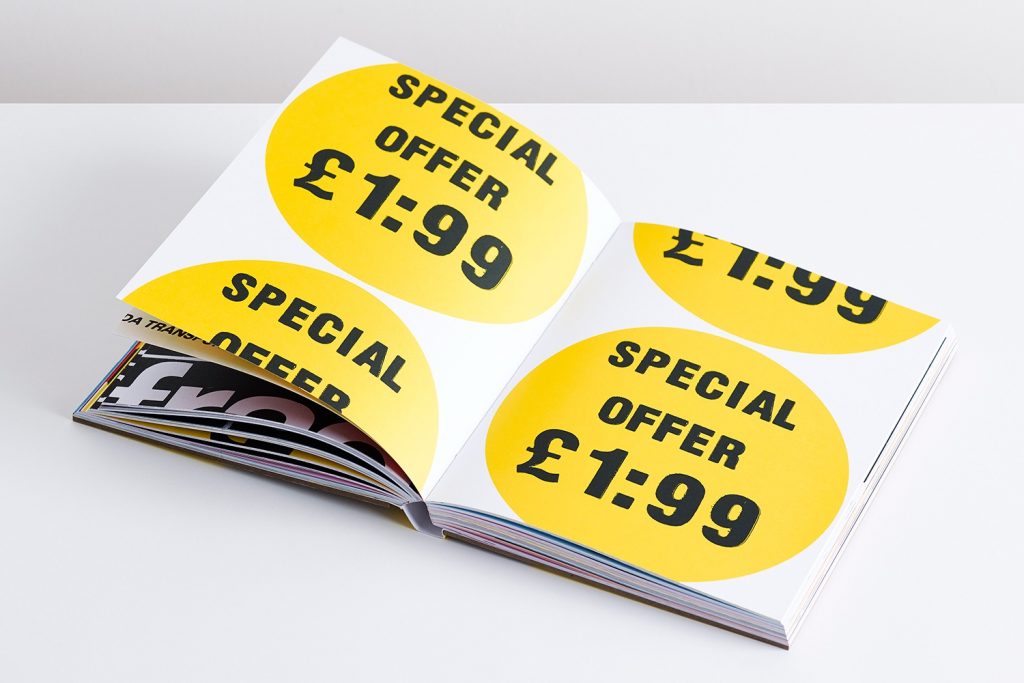
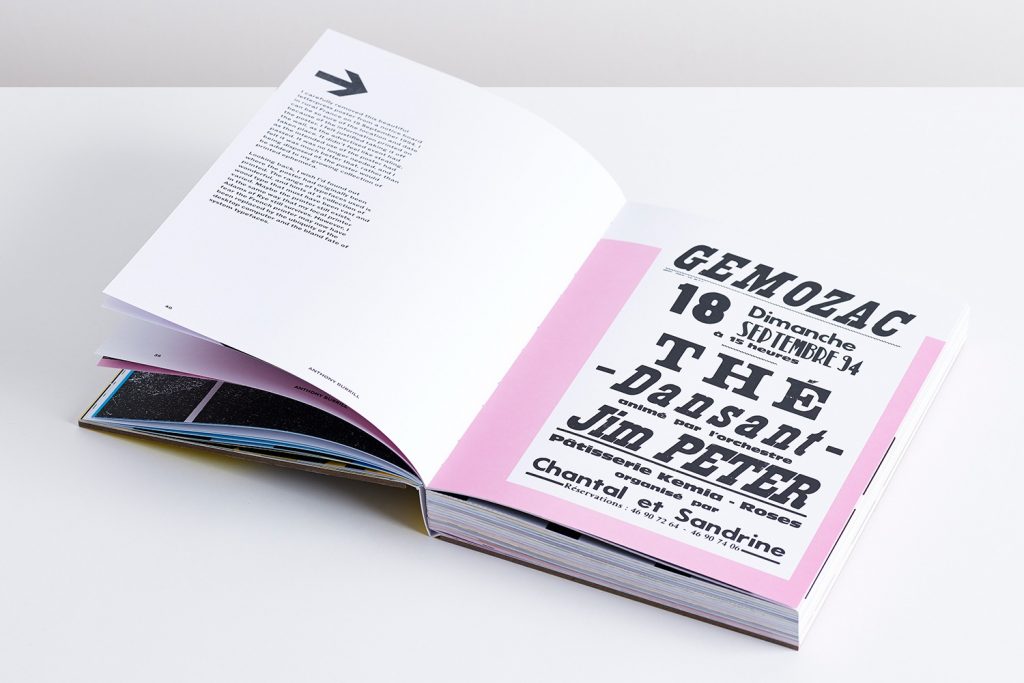
    Anthony Burrill’s Look & See also made me pay more attention to the graphic language of everyday printed materials. I began extracting price marks from Price-Marked Packs (PMPs), as well as logos and typography, turning elements designed for commercial communication into materials for visual analysis.

    However, this process raises another question. When I choose what to collect, enlarge and arrange, I also decide what the audience sees. My arrangements reveal existing connections but also create new ones. Through this research, I want to explore not only what is left on the street, but also how design can give new meaning to the everyday traces we overlook.

    Reference

    Burrill, A. (2017) Look & See. London: Unit Editions.

    Perec, G. (1974) Species of Spaces and Other Places. Translated by J. Sturrock (1997). London: Penguin Books.

    Suter, B. (2016) Parallel Encyclopedia #2. Amsterdam: Roma Publications.

    Varda, A. (dir.) (2000) The Gleaners and I (Les glaneurs et la glaneuse) [Film]. Paris: Ciné-Tamaris.

  • Site Investigation 3

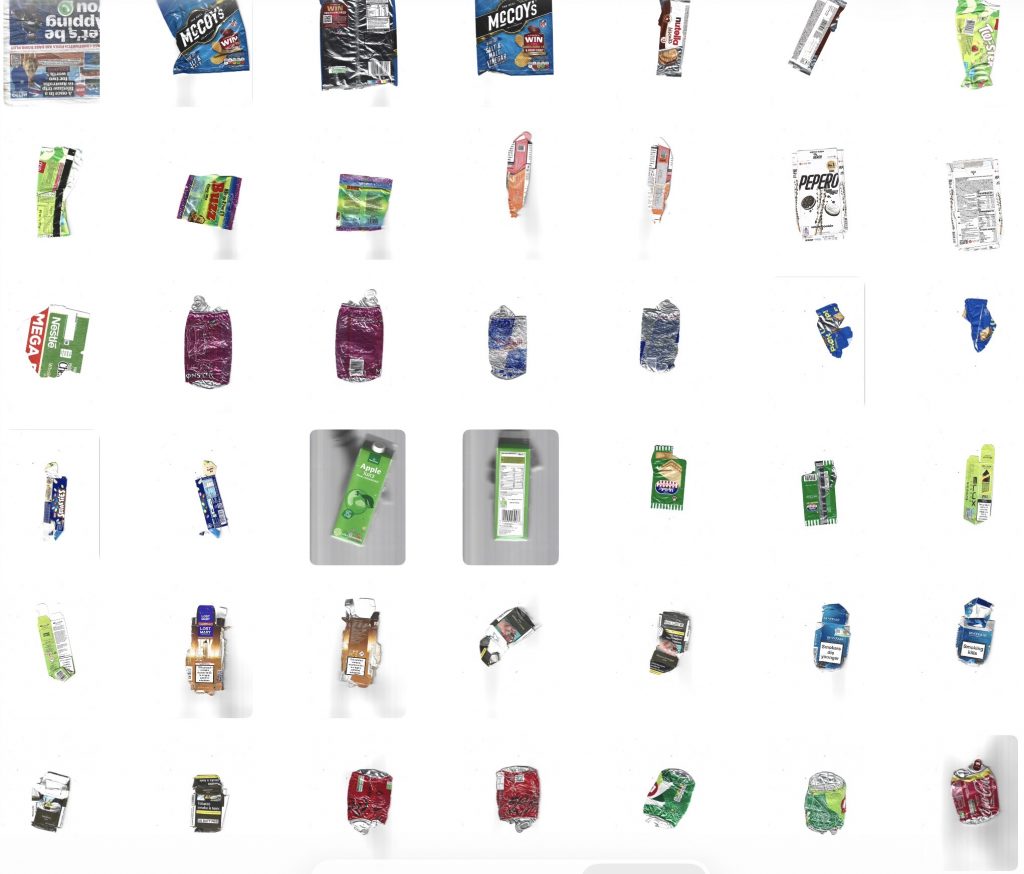
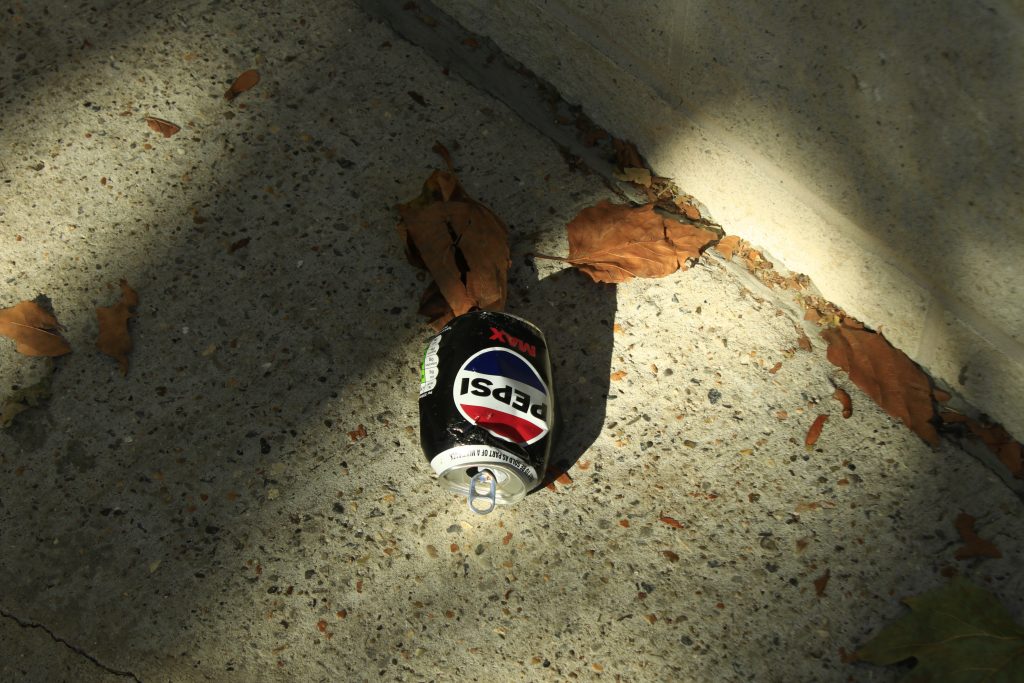
    Returning to Purchese Street, I collected a new batch of street waste and brought the items back to scan them. As I placed each item on the scanner bed, examining their flattened forms and surface textures up close, I began to notice another layer of information: the physical state of the litter reveals how long it has been sitting on the street.
    Many of the aluminum cans, for instance, were completely crushed and heavily scratched—clearly run over by traffic multiple times over a prolonged period, yet left uncollected. These physical signs of wear and tear offer direct visual proof of the area’s maintenance routines, pointing to a noticeable lack of regular street cleaning and municipal care in this public space.

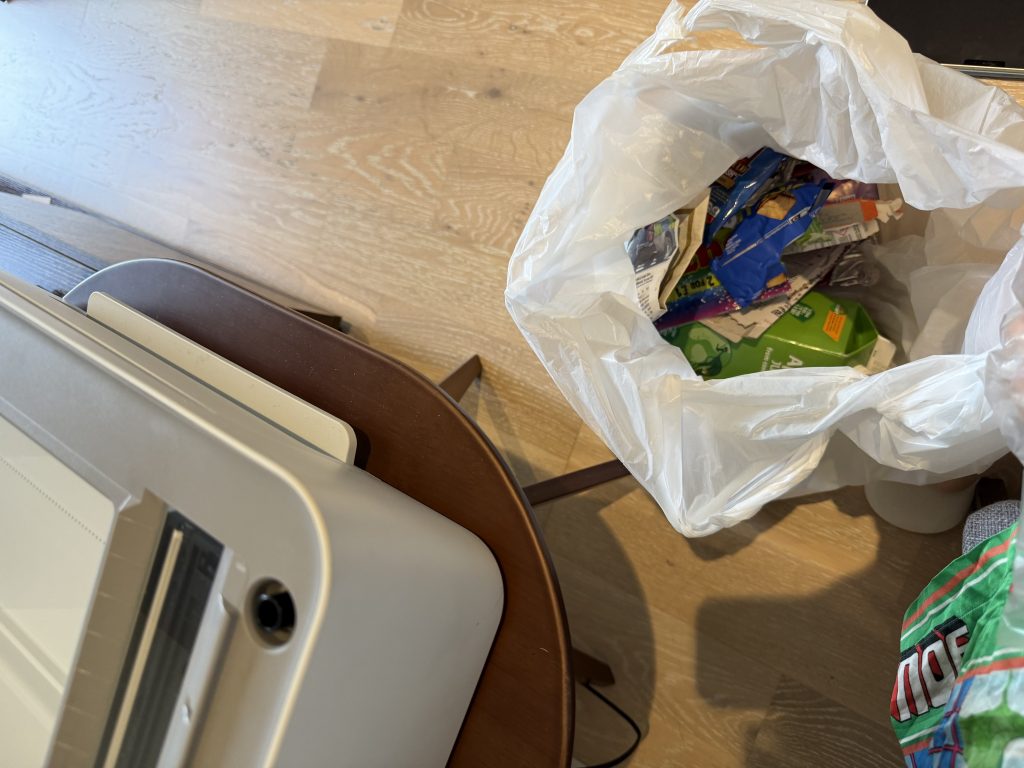
    When scanning the newer litter, I ran into a practical issue. These fresher items are still 3D and bulky, making them really hard to lay flat on the scanner bed.
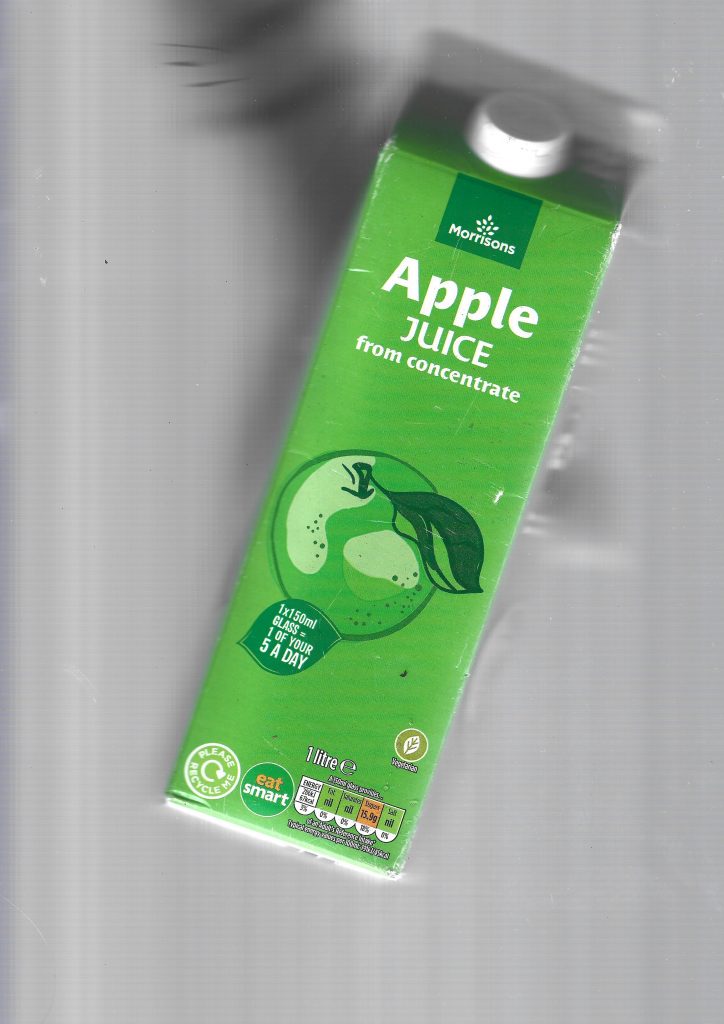
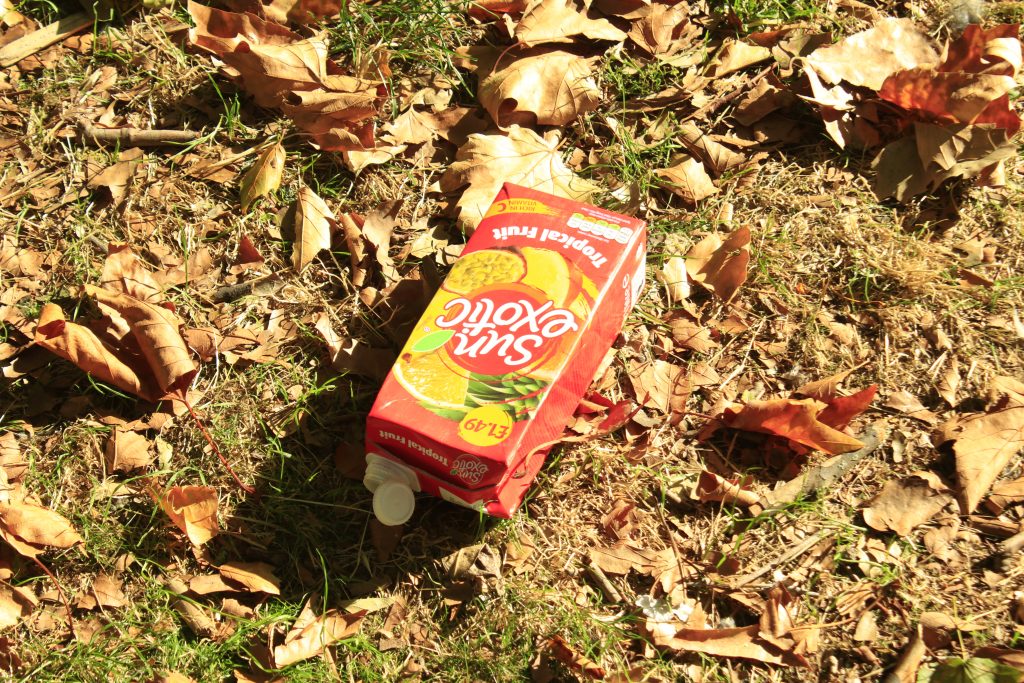
    I tried pressing a juice carton down with my hand during the scan. Surprisingly, it left a subtle, blurry silhouette of my hand in the background. I actually really like this accidental detail because it records the physical act of me interacting with the trash and trying to flatten it.
    I also experimented with cutting the packaging to scan it flat, but it felt like losing the integrity of the original object. Keeping the packages intact, even if it leaves motion blurs and hand prints, captures a much more honest story of the scanning process itself.

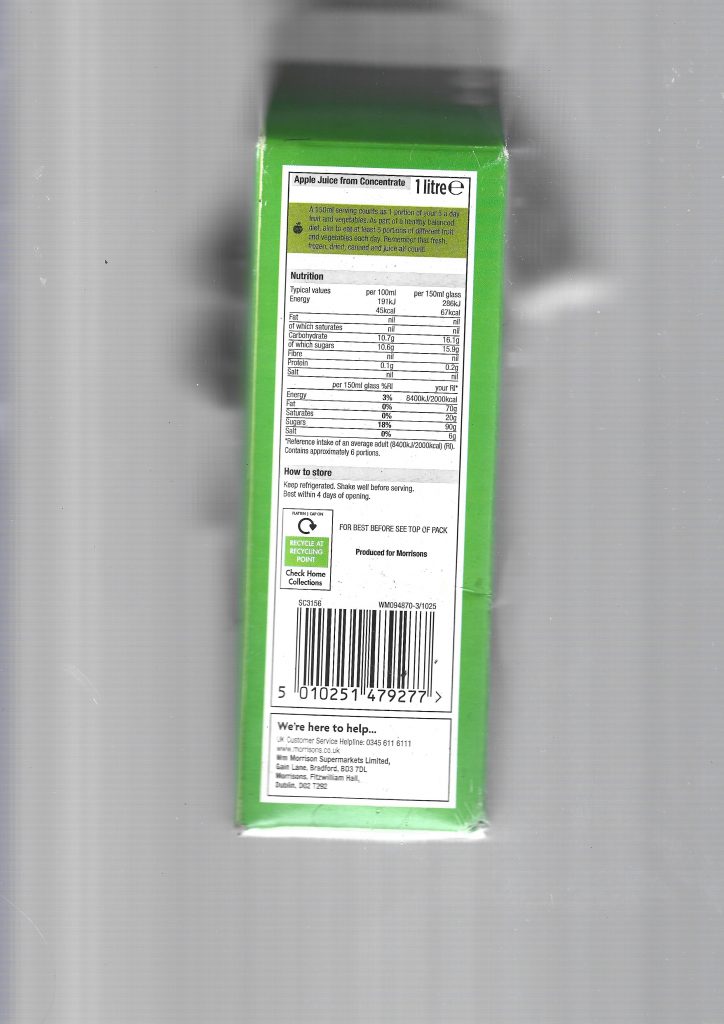
    When I was only using a camera, my knolling process was quite limited. I was basically just taking photos of one flat side of each item. Moving to scanning changed how I look at these objects entirely because it lets me capture every single surface. Scanning all sides of a juice carton or a snack wrapper brings out every graphic detail, from the big brand logos on the front to the tiny ingredients, barcodes, and recycling symbols hidden on the sides. It turns each piece of waste into a full set of graphic components rather than just a static photo.

    Regarding the feedback on methodology, I began to focus on “narrative stacking” rather than simple logical classification. In this exploration, I selected Red Bull aluminum cans and arranged them together. In addition to brand classification, I decided to observe their physical state through the perspective of the scanner. As you can see, there is a clear visual evolution here. A jar still retains a certain sense of three-dimensionality. It may just be discarded not long ago, and I need to cut it or press it by hand to scan it. The other is completely flattened and severely deformed, and their physical form is like a biography. You can almost estimate how long each jar has been on the street. Some are only a few hours, and some are up to weeks. They have been run over by vehicles many times and are completely unmanaged.

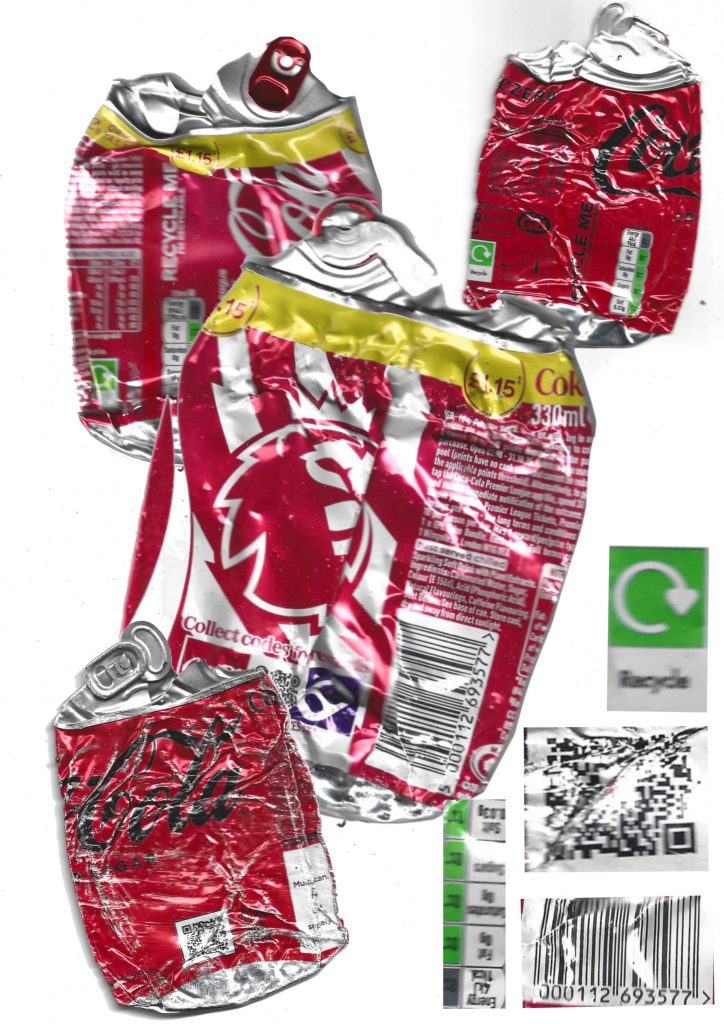
    In my next round of experiments, I began to deconstruct the performance of an iconic brand in multiple discarded items. I collected several different cola aluminum cans and arranged them. I separated and extracted specific non-colour graphic elements: black barcodes, tiny black text warnings, small green recycling logos, and even greyscale elements such as QR codes, juxtaposed with red jars. I began to examine the visual operation of different levels of graphic communication, strong marketing orientation “red” and How is the unified packaging integration between the “black/green” elements that only contain information?

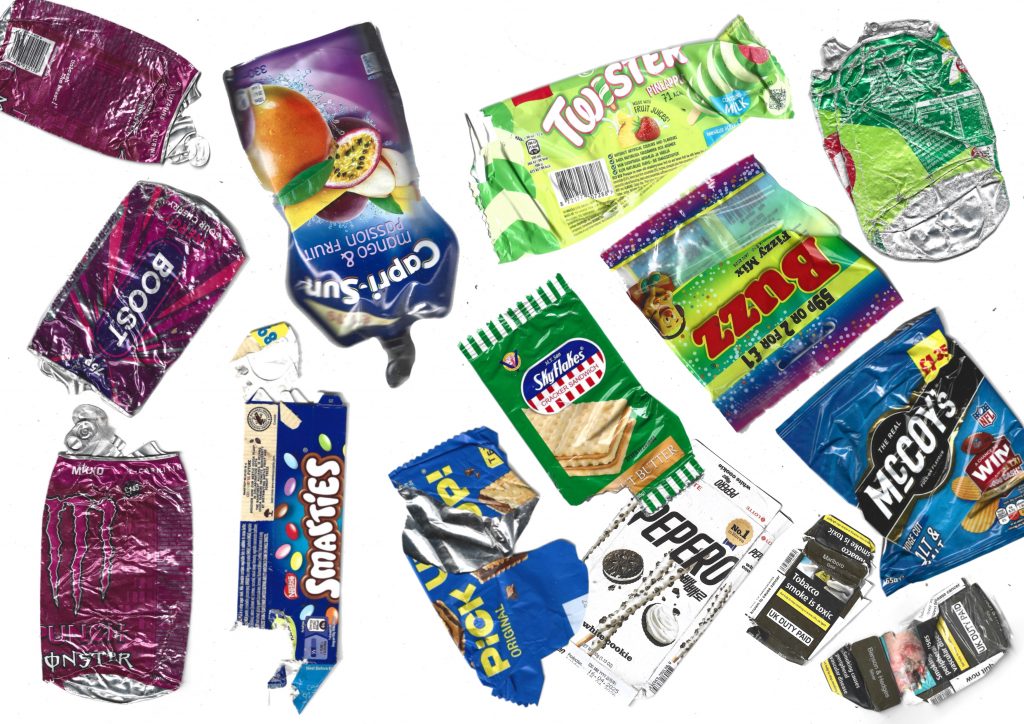
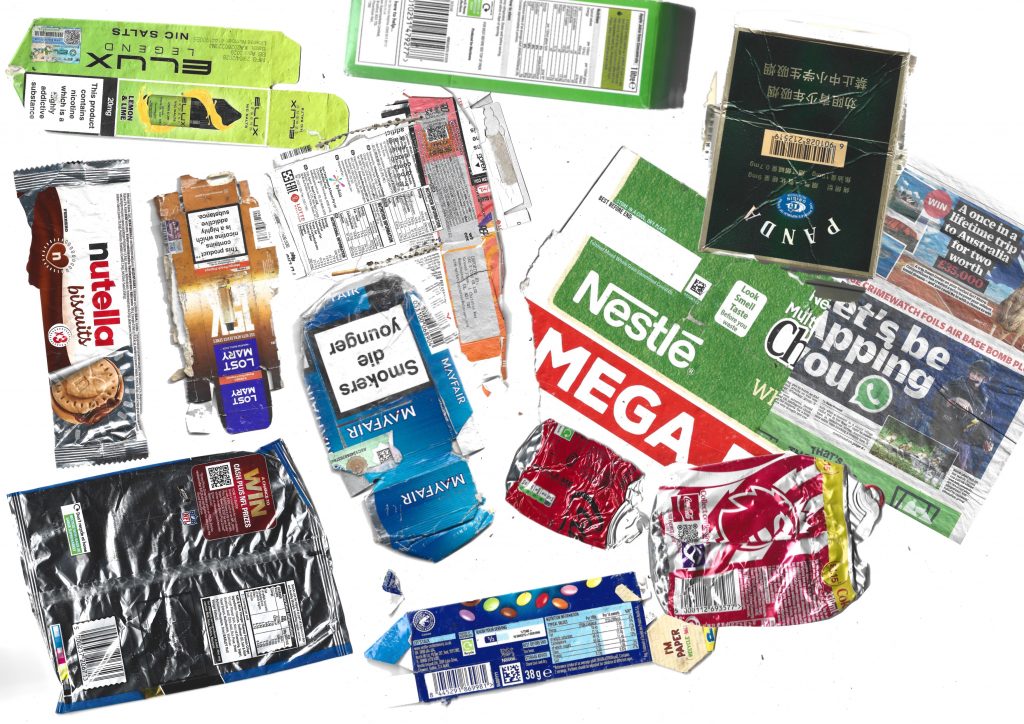
    In the iteration, inspired by Batia Suter’s work, I completely abandoned the way of classifying by product type and focussed entirely on visual association. I want to see how the packaging from unrelated products is interconnected. I connect items with each other based on similar elements. They can be arranged according to colour or through shared patterns and graphics.

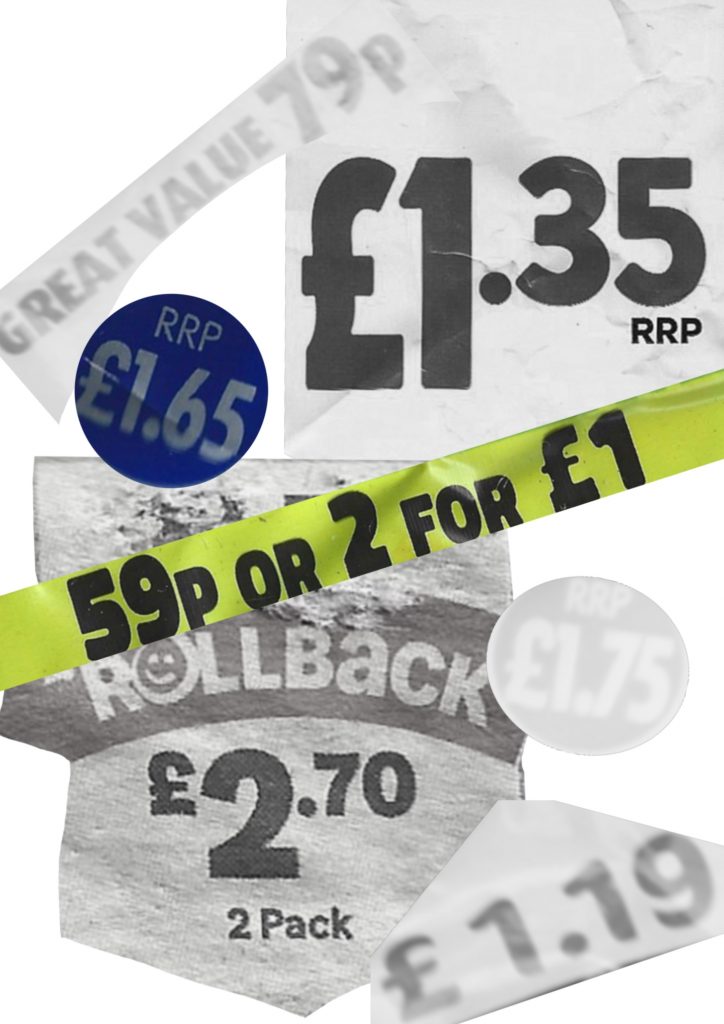
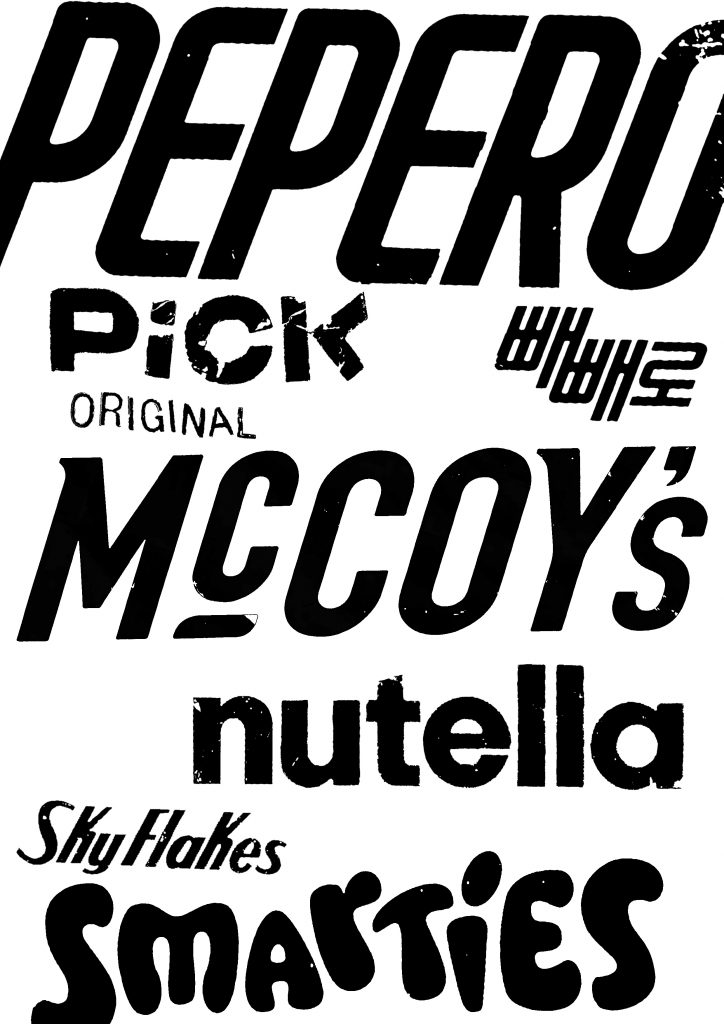
    Inspired by Anthony Burill in Look and See, I further promoted the deepening of graphic research by separating specific visual elements from the scanned packaging. Instead of maintaining the integrity of the item, I extracted two different graphic levels: price tags and brand logos.

    On the left, I group the price tags and promotional stickers. Highlighting these numbers alone highlights their bold, aggressive typesetting and direct visual urgency. These price tags are designed to attract attention on the shelves, using thick sarif fonts and high-contrast shapes.

    On the right side, I extracted the brand logo and converted it into a simple black-and-white typesetting collage. After removing its iconic colours, it shows the original characteristics and diversity of their customised fonts.

  • further developed investigation

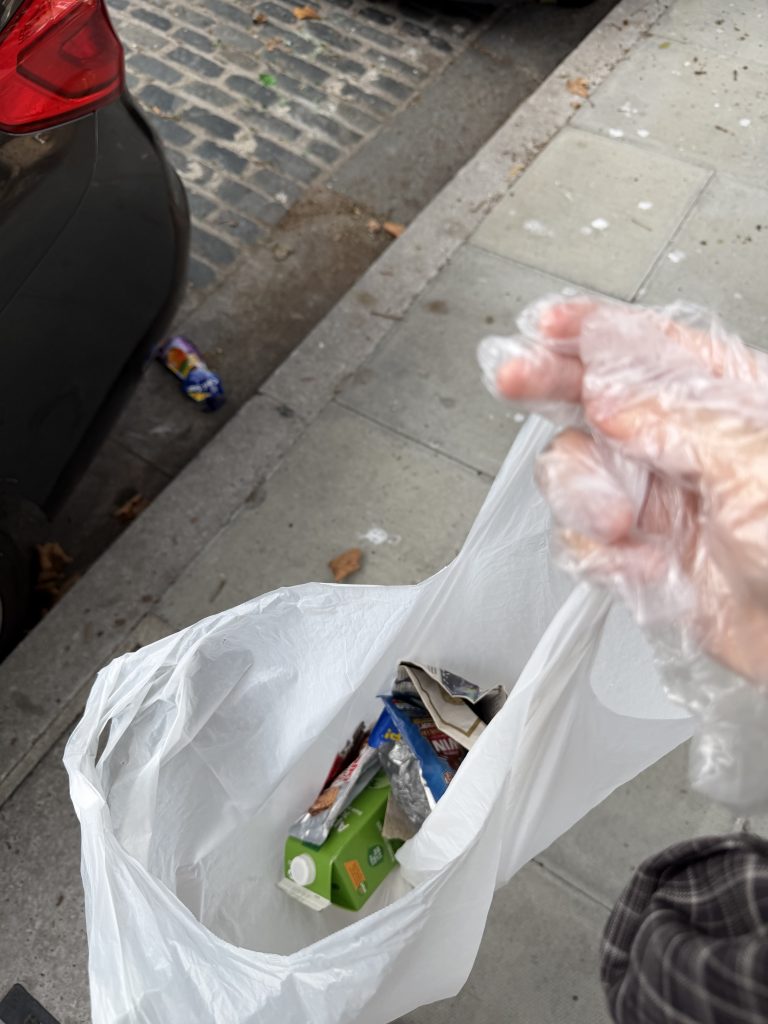
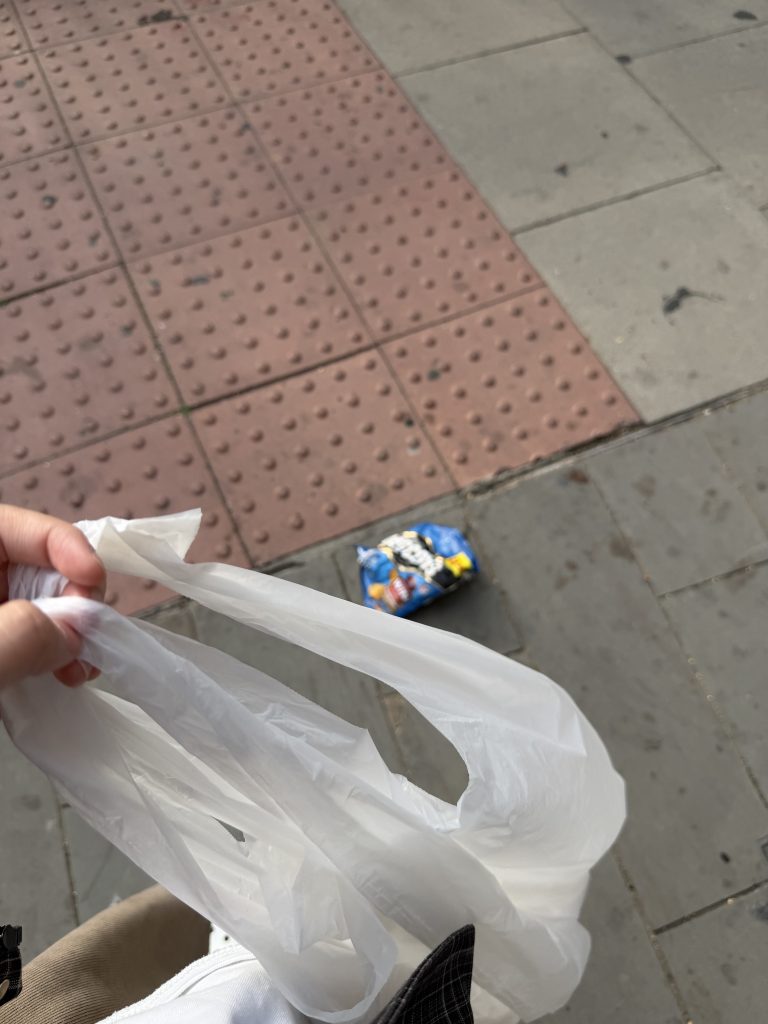
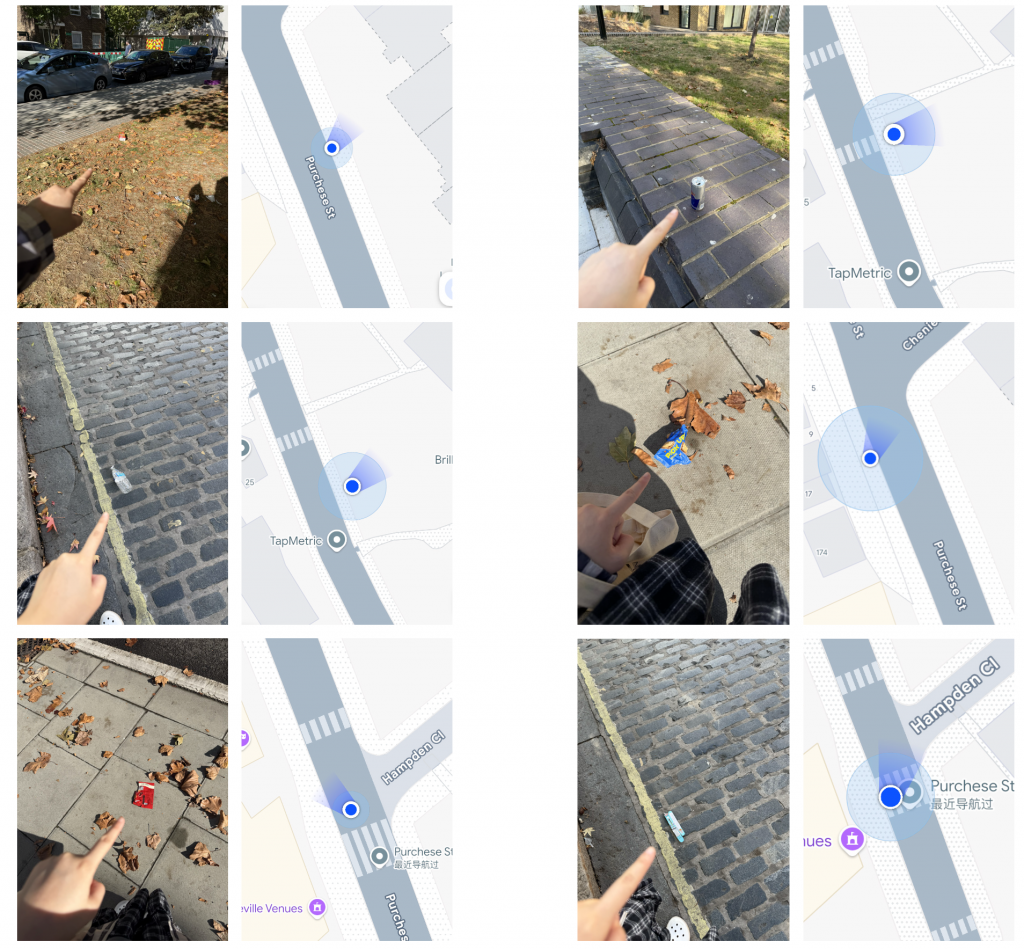
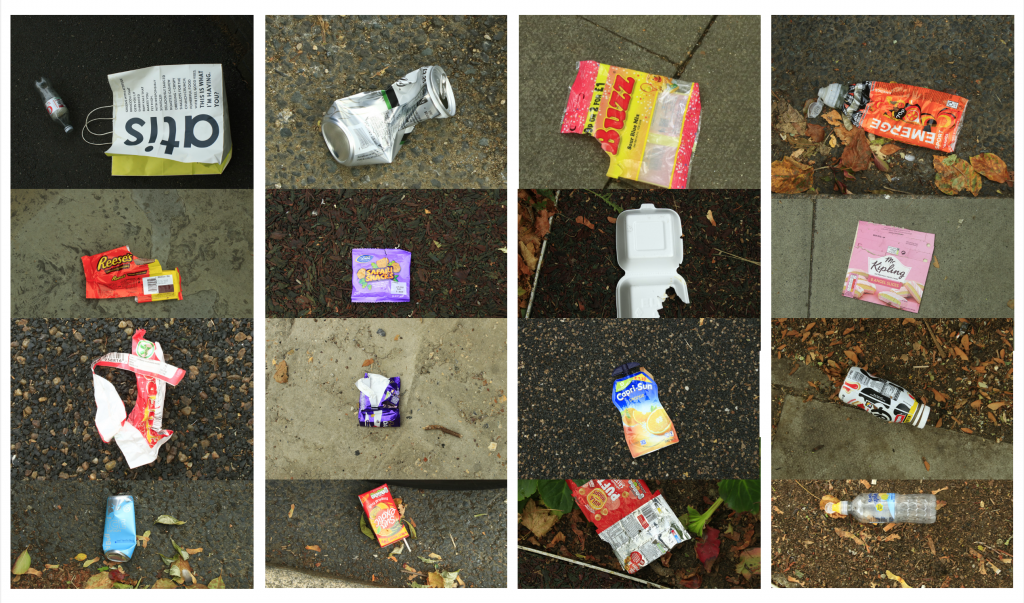
    Following the feedback from my recent tutorial, I returned to Purchese Street for a second site observation. This time, I noticed a whole new range of discarded items along the pavement that I hadn’t documented before. 
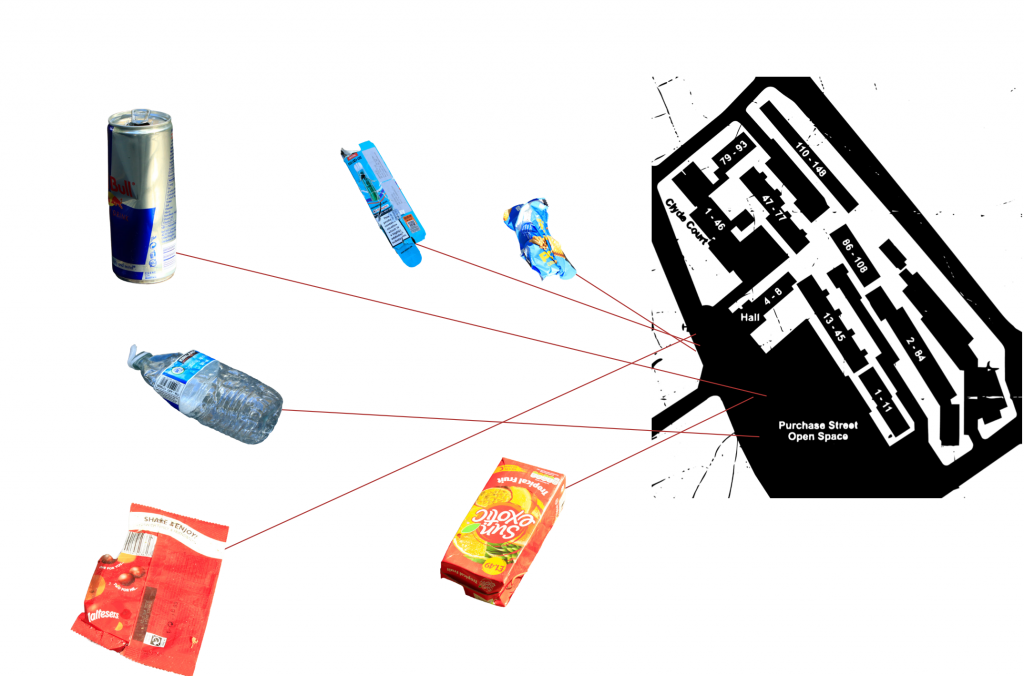
    I used my camera to photograph these newly discovered waste items in detail, capturing their material properties, brand logos, and condition. To prepare for a more structured visual analysis, I also took precise screenshots of my GPS location on Google Maps for every item I photographed. These location coordinates will serve as the foundation for creating a comprehensive site map in the next stage, helping me explore potential correlations between specific waste items and their spatial surroundings. 

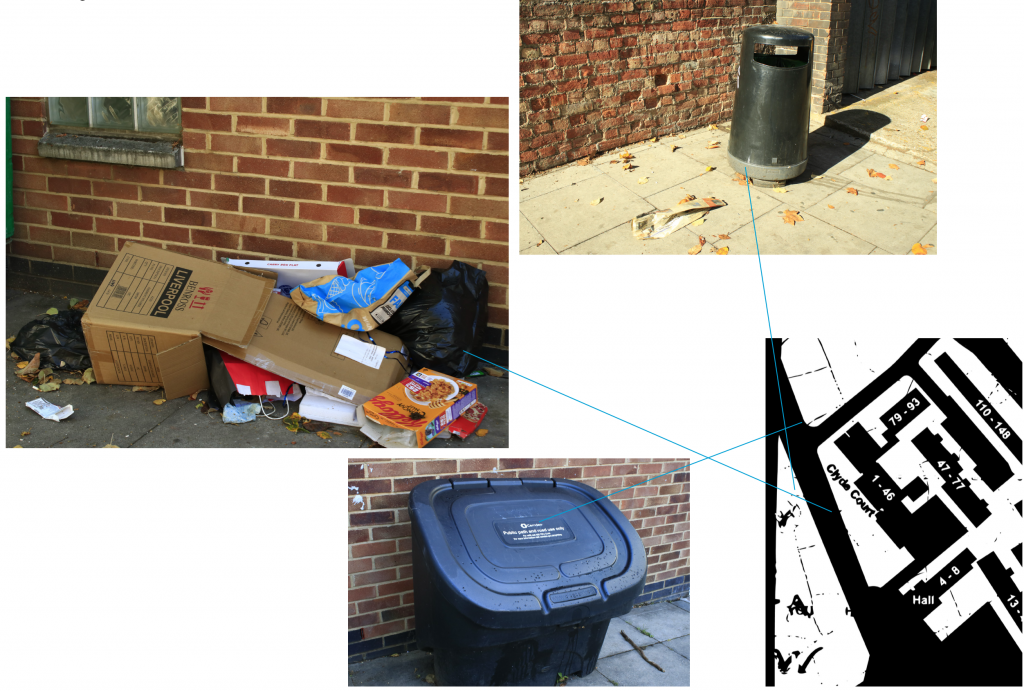
    In addition to individual litter items, I also spent time identifying and mapping the static infrastructure along the street—specifically public trash cans and clusters of bulky fly-tipping. I recorded their exact GPS coordinates on Google Maps alongside the photographs. 
    My goal now is to overlay these two maps: one showing the distribution of everyday street litter, and the other marking public bins and large abandoned items. By comparing these spatial layers, I hope to uncover potential patterns and gaps—such as whether litter accumulates in specific “blind spots” far from public trash cans, or if the presence of bulky waste actively encourages further illegal dumping in the immediate area. 

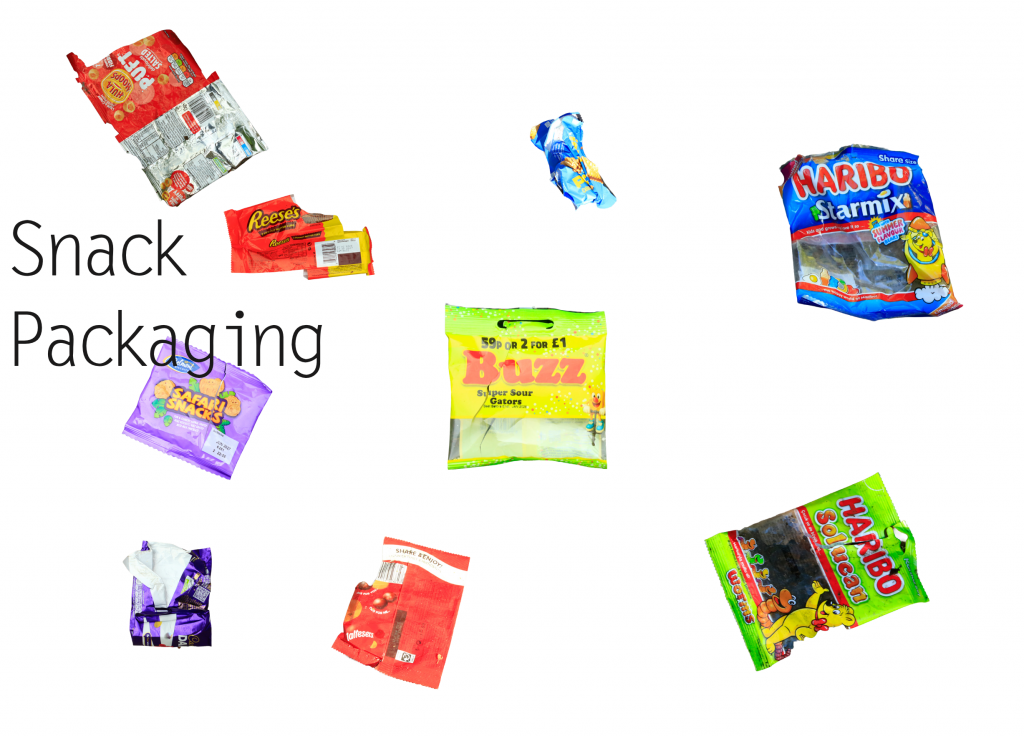
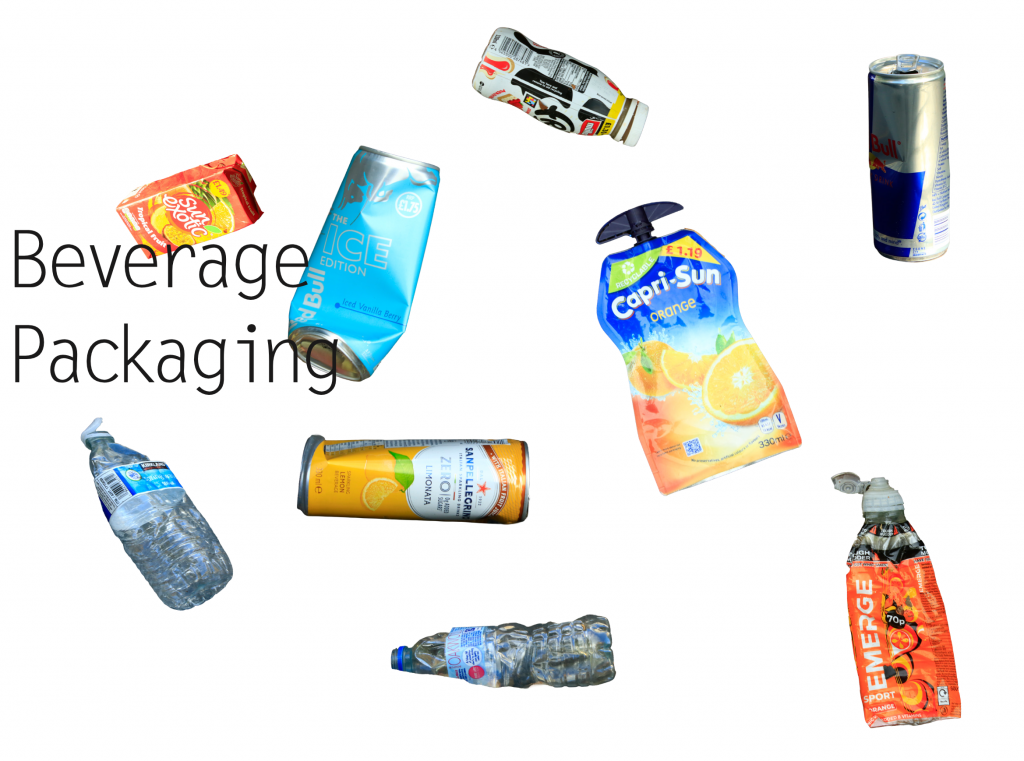
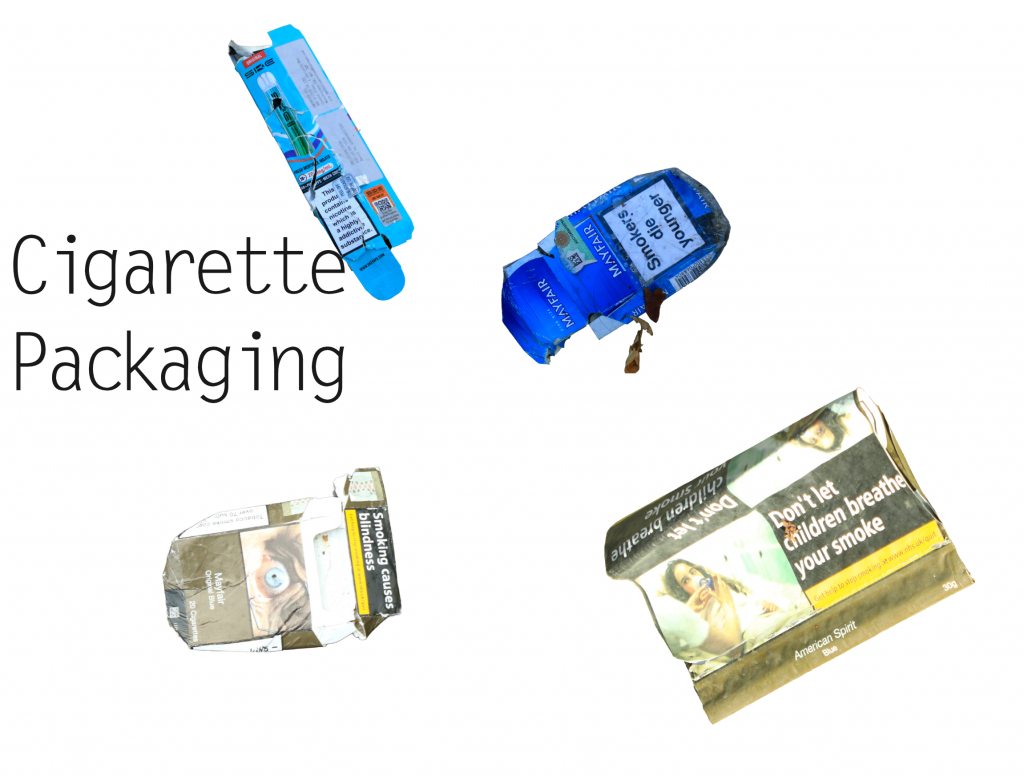
    To move away from sorting things just by how they look, I tried a new way of grouping the waste based on what the items actually are: drinks, snacks, and tobacco/vaping packaging.
    Sorting them like this made a big difference. It instantly showed what people are usually buying and consuming on the street. Instead of looking at them as random trash, grouping items by product type helped me see how everyday habits directly shape what gets left behind on the pavement.

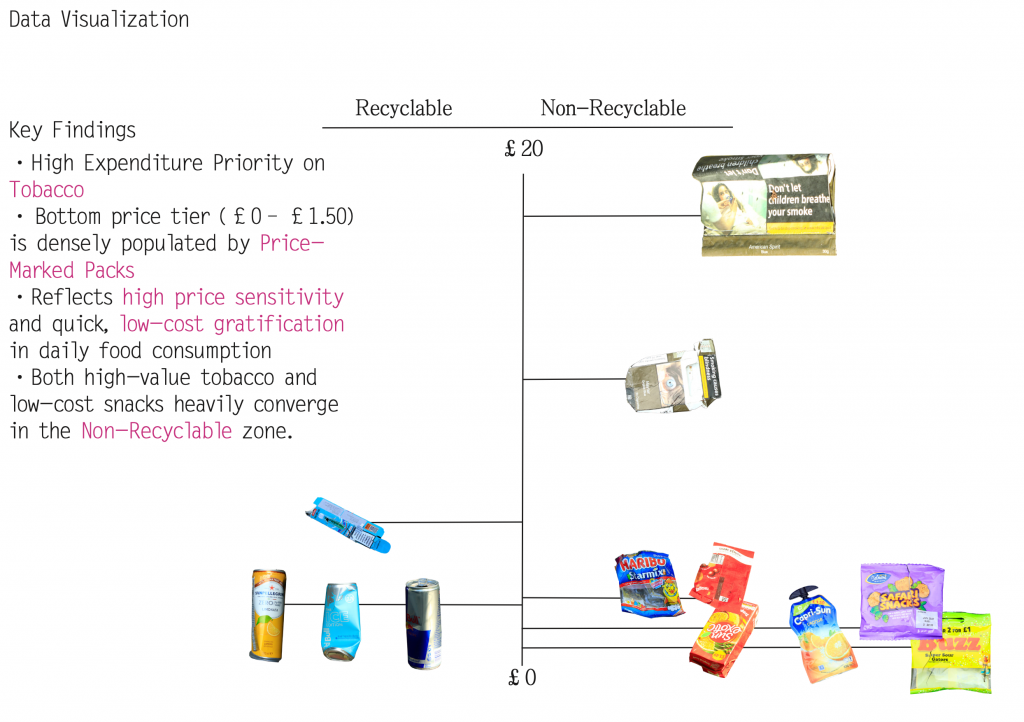
    Following my tutor’s feedback, I also carried out a deeper material and economic audit of the collected waste. I analysed each item based on its brand, estimated price point, and material composition. 
    To make sense of these relationships, I created a data visualisation mapping all the items onto an X/Y scatter plot. The X-axis measures recyclability (ranging from fully recyclable to non-recyclable), while the Y-axis tracks the price range of the original products. By plotting these elements together, I aim to uncover whether there is a correlation between low-cost disposable items, brand accessibility, and their eventual likelihood of ending up as non-recyclable street litter. 

    10.2 Tutorial Feedback

    During my latest tutorial, my tutor pointed out that my current color-based knolling remains somewhat on the surface—functioning more as a standard visual archive than a personal research tool. To transform this raw data into something uniquely my own, my tutor suggested a more intimate, graphic approach: high-resolution scanning. By scanning the collected packaging instead of just photographing it, I can zoom in on tactile details—focusing on local typography, brand logos, print textures, and signs of wear-and-tear.
    To help me move beyond superficial classification, my tutor introduced two key reference works:
    1.Batia Suter (Parallel Encyclopedia 2): Demonstrates how juxtaposing scanned images and visual fragments can build unexpected narratives beyond mere categorization.
    2.Anthony Burrill (Look & See): Shows how zooming in on everyday vernacular typography and graphic language can uncover the cultural personality of a place.

    Inspired by these approaches, I am shifting my knolling process from a passive sorting exercise into an active method of visual storytelling. By curating and reassembling these scanned graphic components—logos, text fragments, and material textures—I aim to develop a distinctive graphic language that reflects the street’s socioeconomic identity while making the work truly my own.

  • Site: Purchese Street

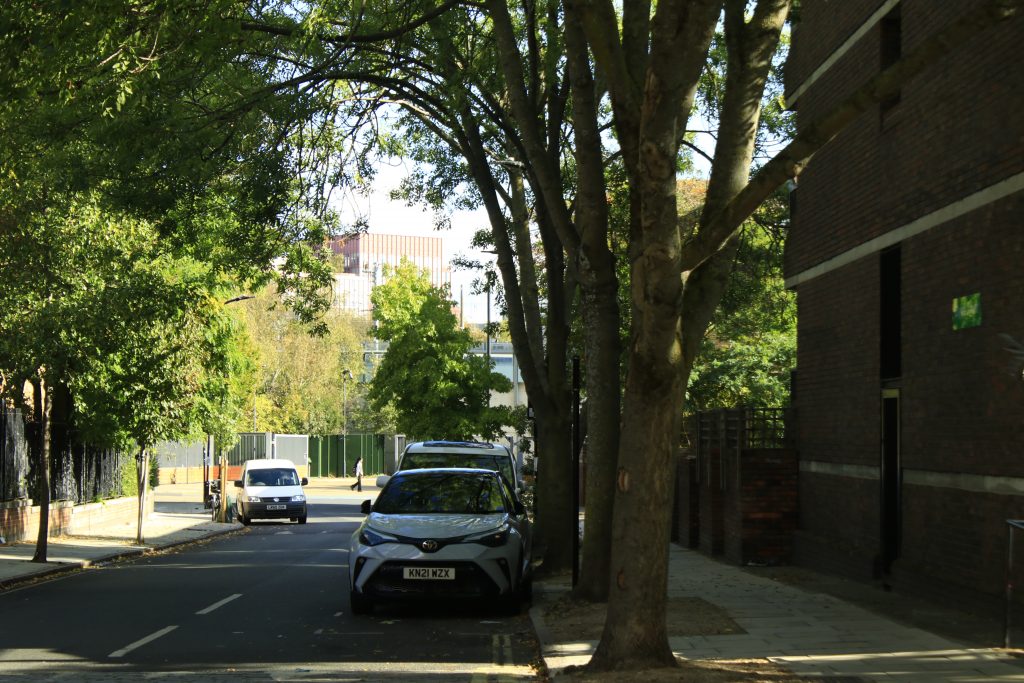
    Located close to King’s Cross, Purchese Street sits within a very different social and commercial landscape. Despite their physical proximity, the two areas reveal contrasting forms of retail, public space and everyday consumption.

    Spatial Observation

    View towards King’s Cross from Purchese Street.

    Method 1: Knolling

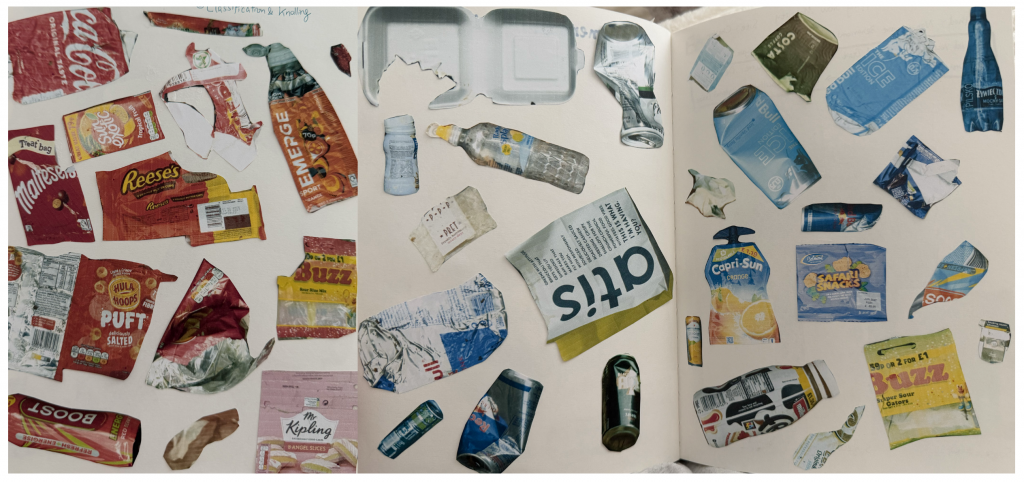
    My initial fieldwork began with a stark spatial contrast: as I walked away from the privately managed King’s Cross area into Purchese Street, I noticed a sudden surge in street litter. To document this visual anomaly, I photographed the abandoned items, printed and hand-cut their forms, and organised them into color-coordinated knolling layouts in my sketchbook. This tactile mapping process allowed me to analyse both their material composition and visual presence.

    Method 2: Mapping human movement

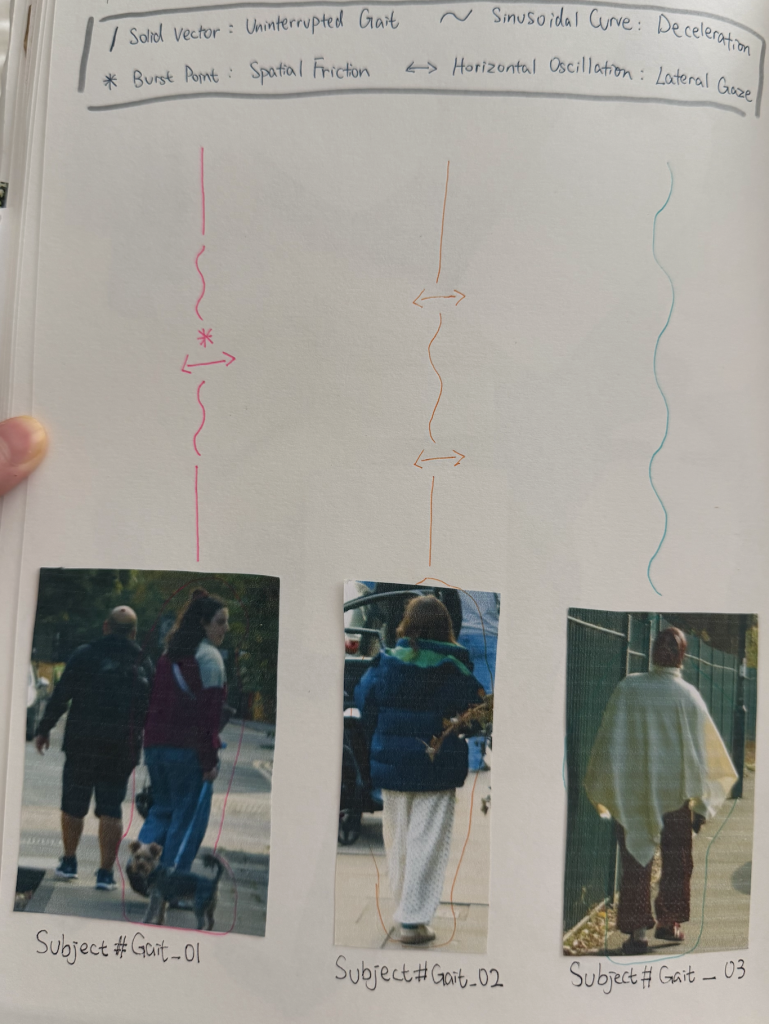
    After looking at street waste, I turned my focus to the people walking through the neighborhood. To record how people move along Purchese Street, I created a simple drawing system. A straight line shows someone walking at a steady speed, while a wavy line shows them slowing down or hesitating. When someone stops or looks around, I marked it with star points or side-to-side arrows. Instead of just tracking where people were going, this method helped me notice how the street environment naturally changes people’s walking pace. 

    Method 3: Documenting Bulky Fly-Tipping on the Street

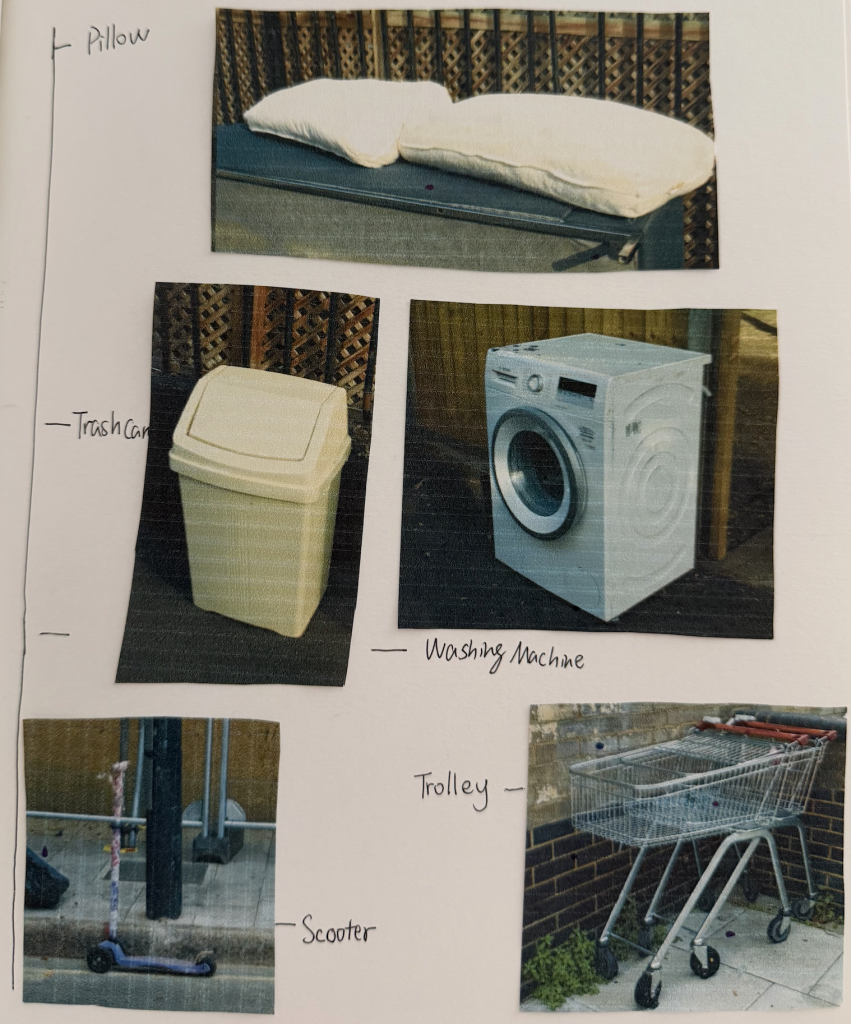
    Beside small packaging, I also noticed larger discarded items along the street, like pillows, a washing machine, a trash can, a scooter, and a shopping trolley. I photographed these bulky items and categorized them in my sketchbook along a scale. Seeing intimate domestic objects and heavy appliances left out on the pavement highlights how private household waste overflows directly into public spaces. 

    9.25 Tutorial Feedback

    During my tutorial on September 25, I shared my initial experiments with color-based knolling and received some insightful feedback from both my tutor and peers.
    My tutor noted that while arranging waste by color is a strong visual starting point, I shouldn’t limit myself to just one dimension. They suggested pushing the analysis further by categorising items through brand identity, materiality, and price point. Meanwhile, my peers recommended taking a more spatial approach by mapping the exact locations where each item was found and recording their physical dimensions.
    Taking these suggestions forward, my next step is to analyze the collected waste by brand and price, while mapping their precise locations on site. My goal is to see what new spatial patterns and socioeconomic stories might emerge from these deeper layers of data.

  • Hello world!

    Welcome to myblog.arts. This is your first post. Edit or delete it, then start blogging!