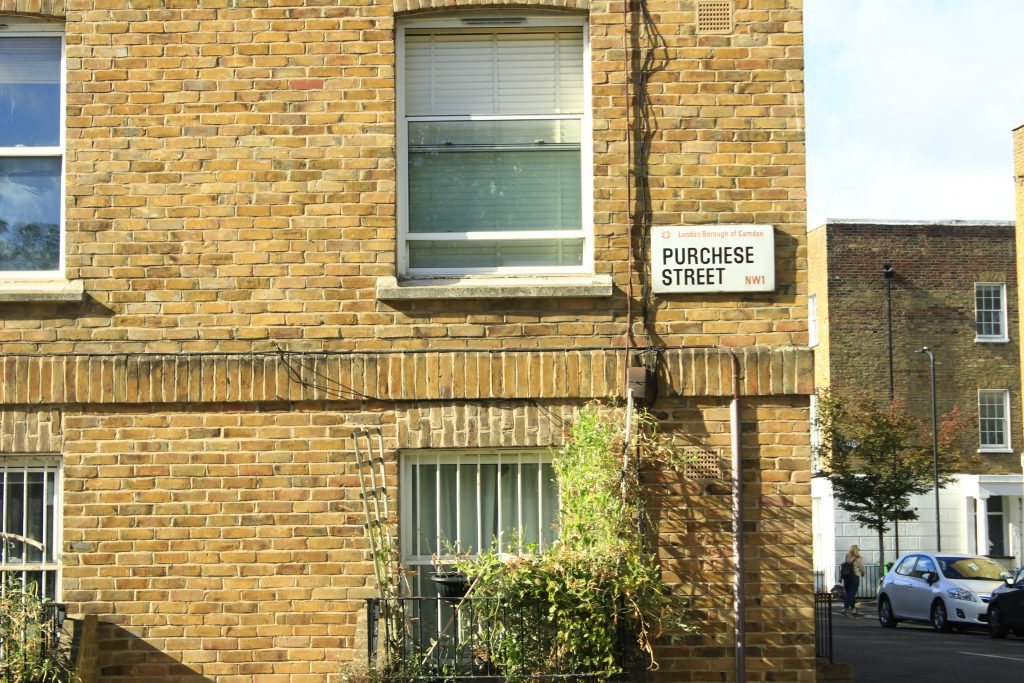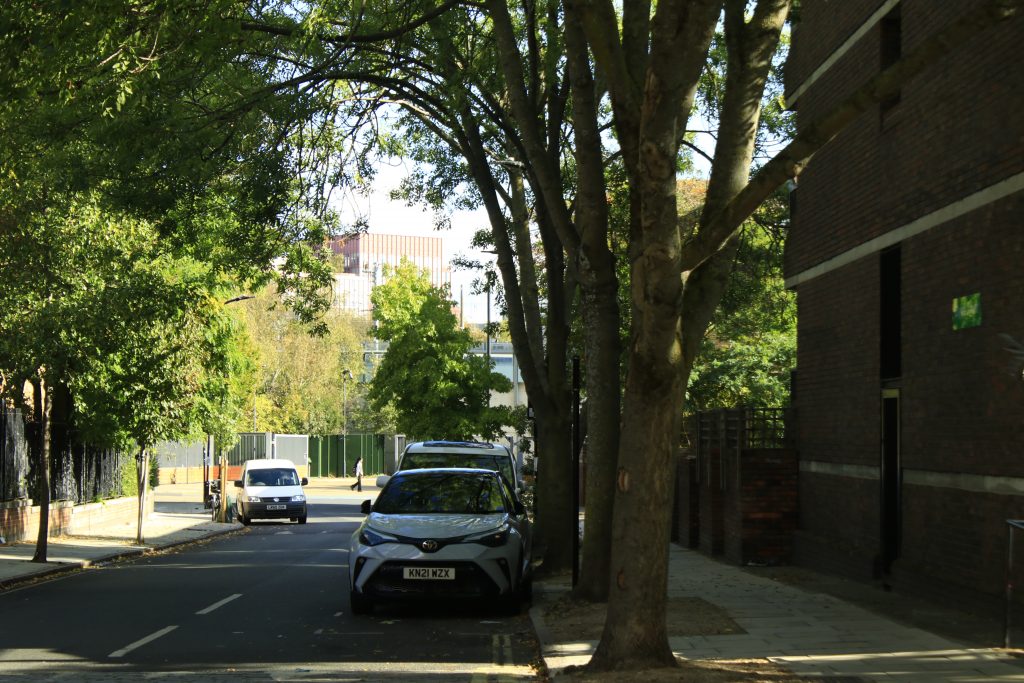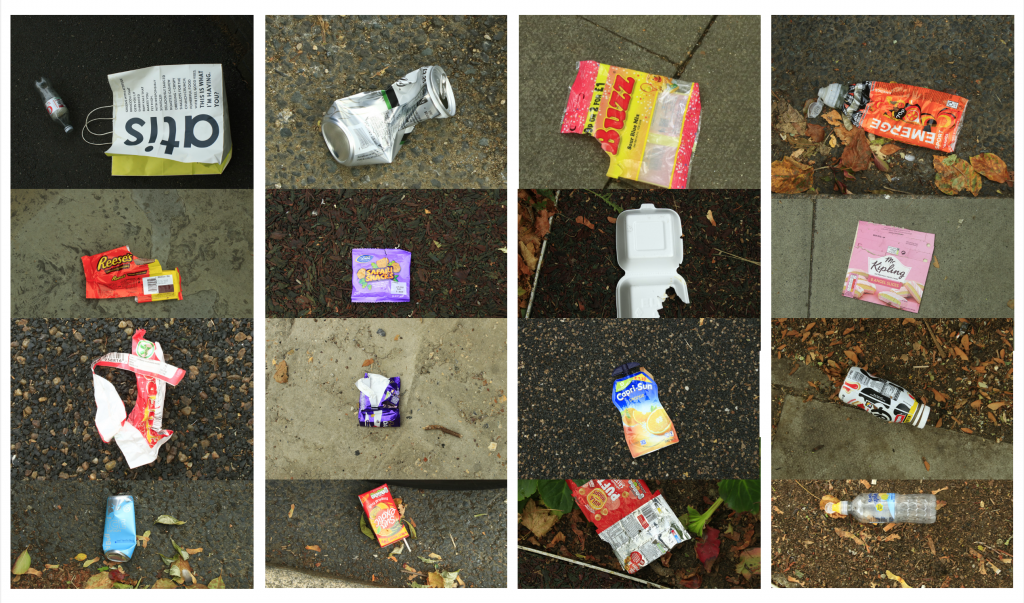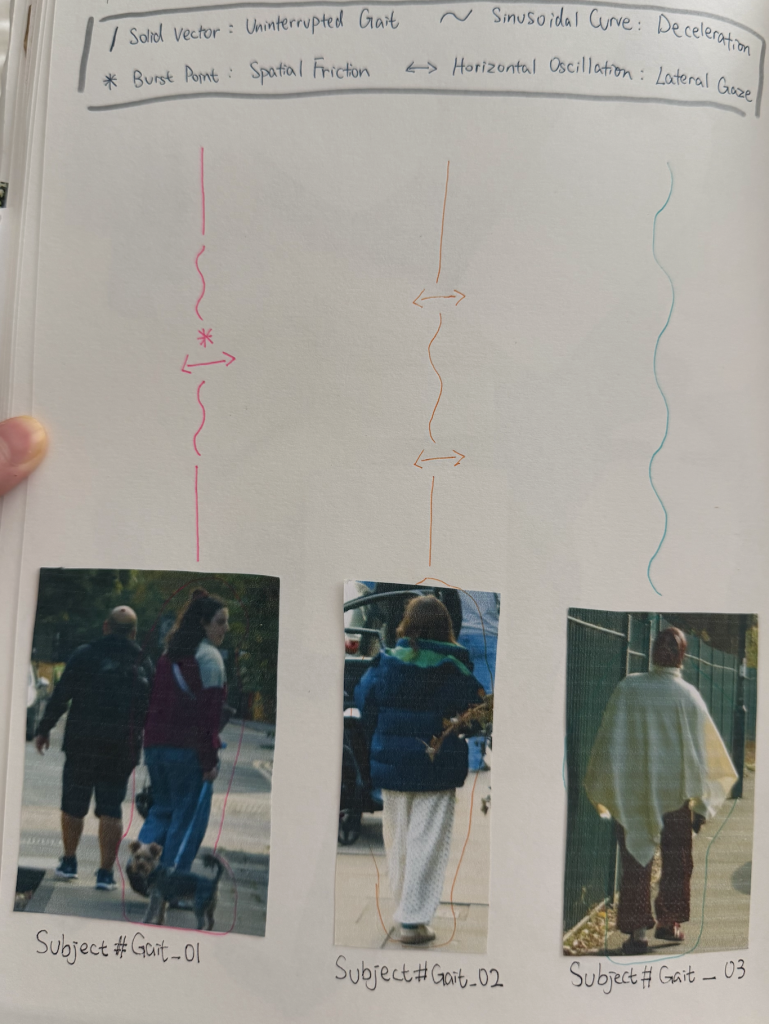
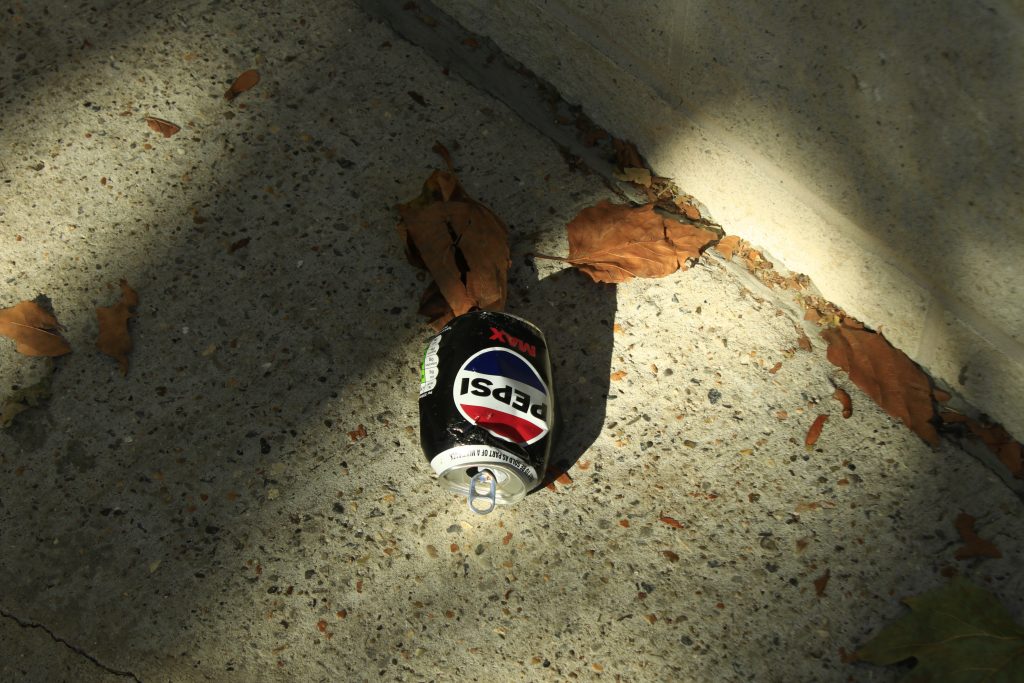
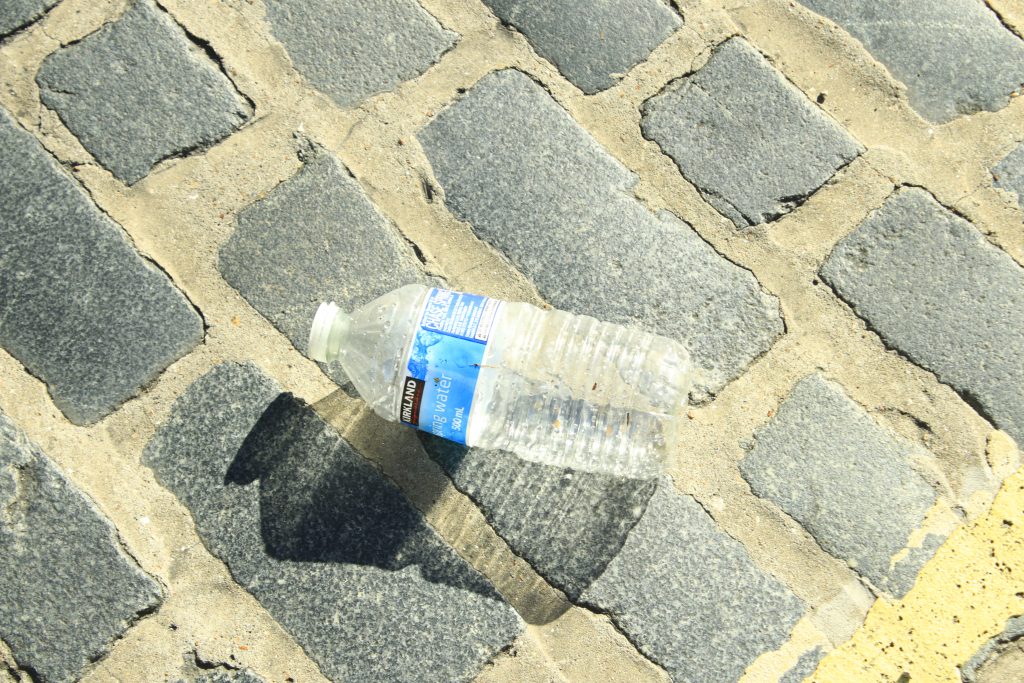
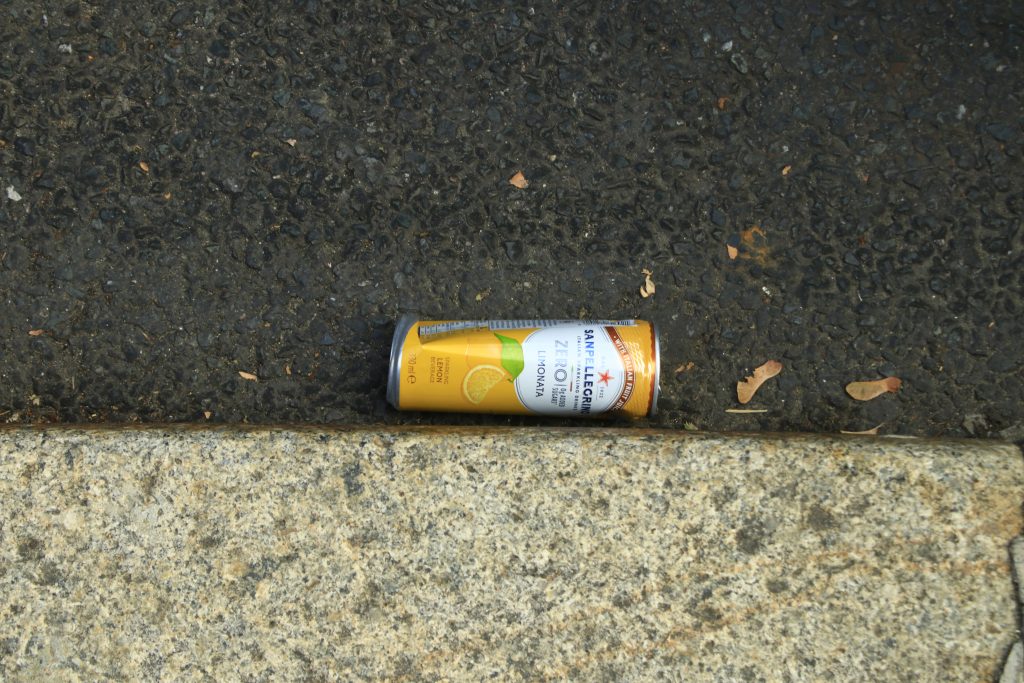
Following the feedback from my recent tutorial, I returned to Purchese Street for a second site observation. This time, I noticed a whole new range of discarded items along the pavement that I hadn’t documented before.
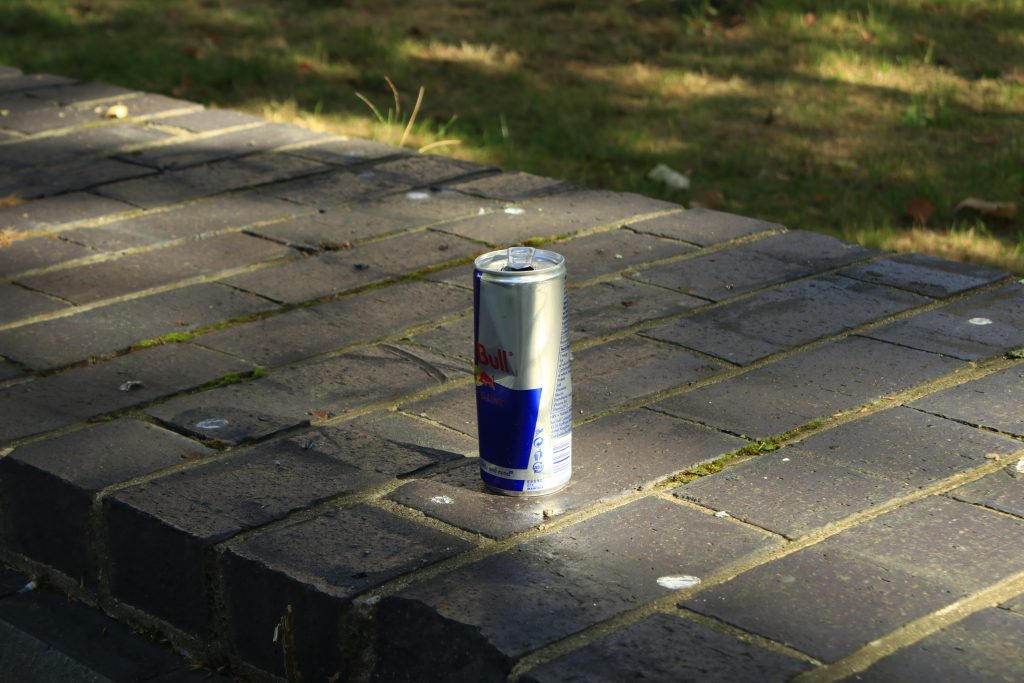
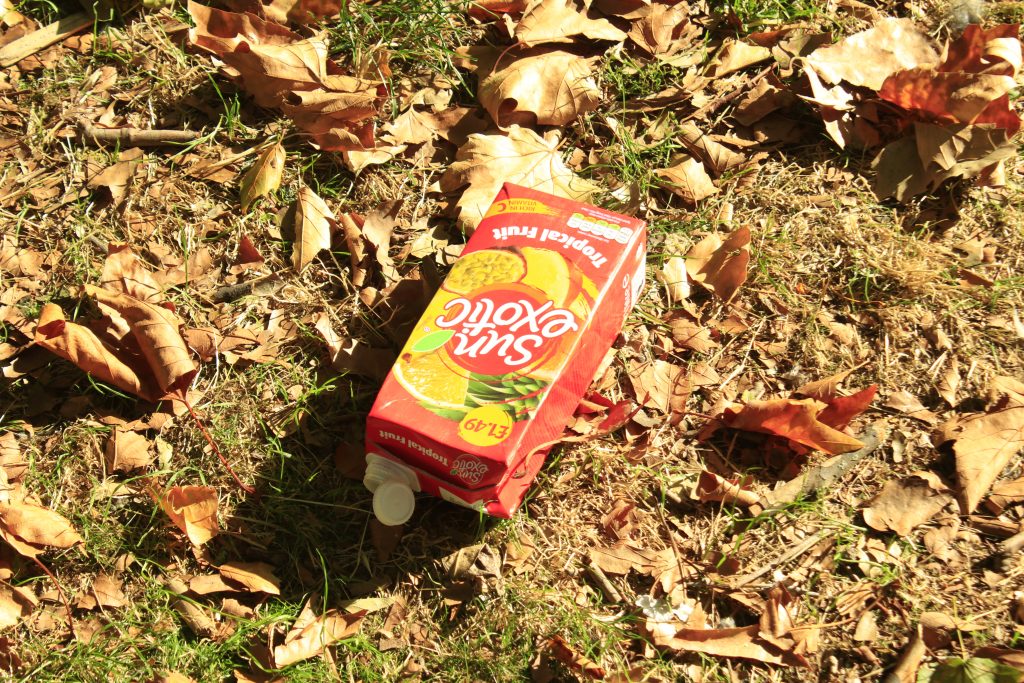
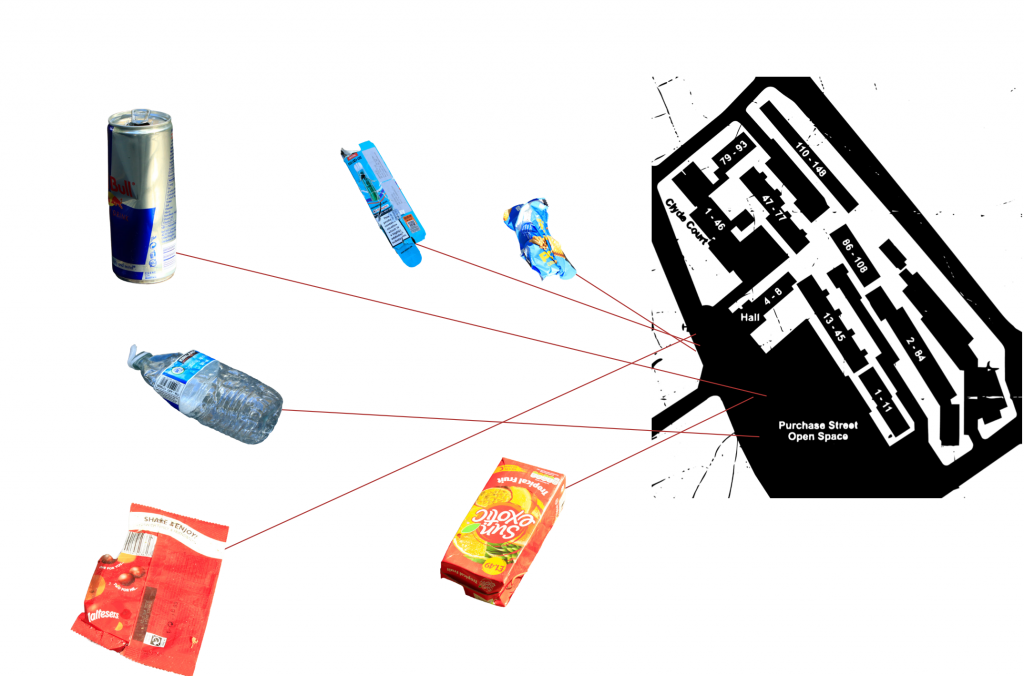
I used my camera to photograph these newly discovered waste items in detail, capturing their material properties, brand logos, and condition. To prepare for a more structured visual analysis, I also took precise screenshots of my GPS location on Google Maps for every item I photographed. These location coordinates will serve as the foundation for creating a comprehensive site map in the next stage, helping me explore potential correlations between specific waste items and their spatial surroundings.
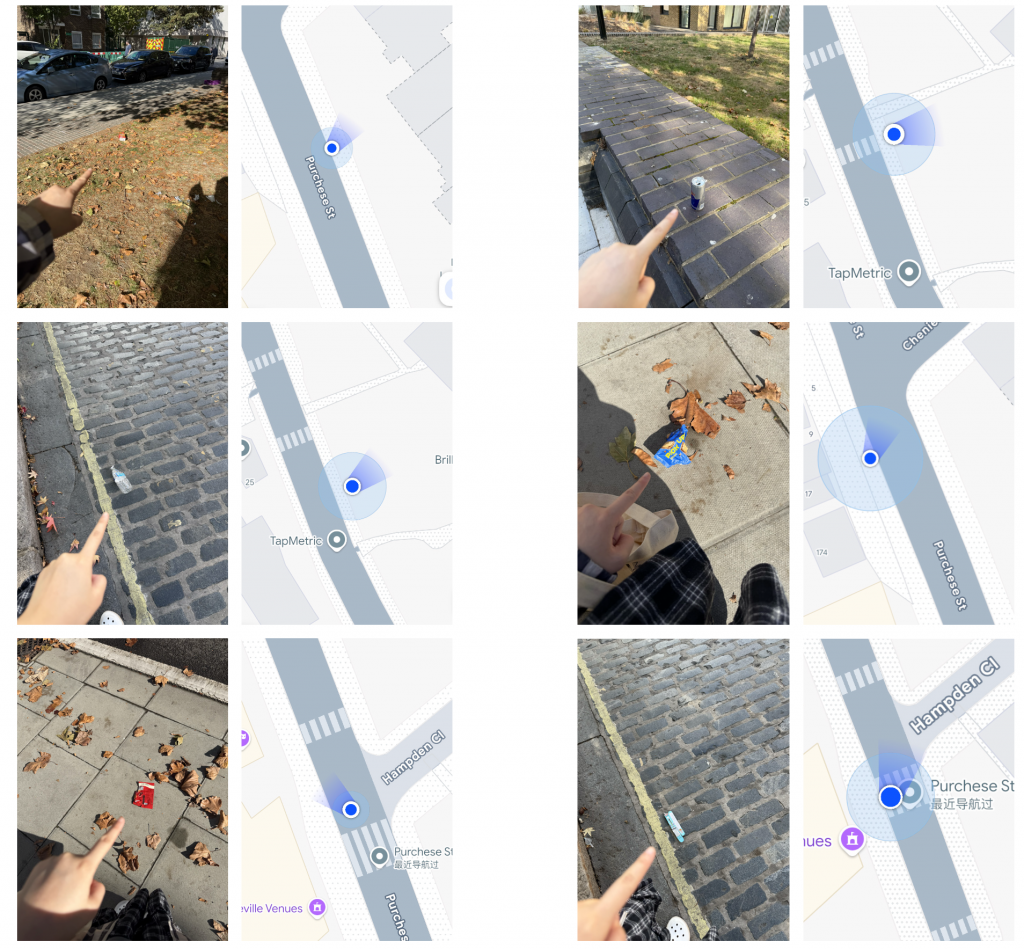
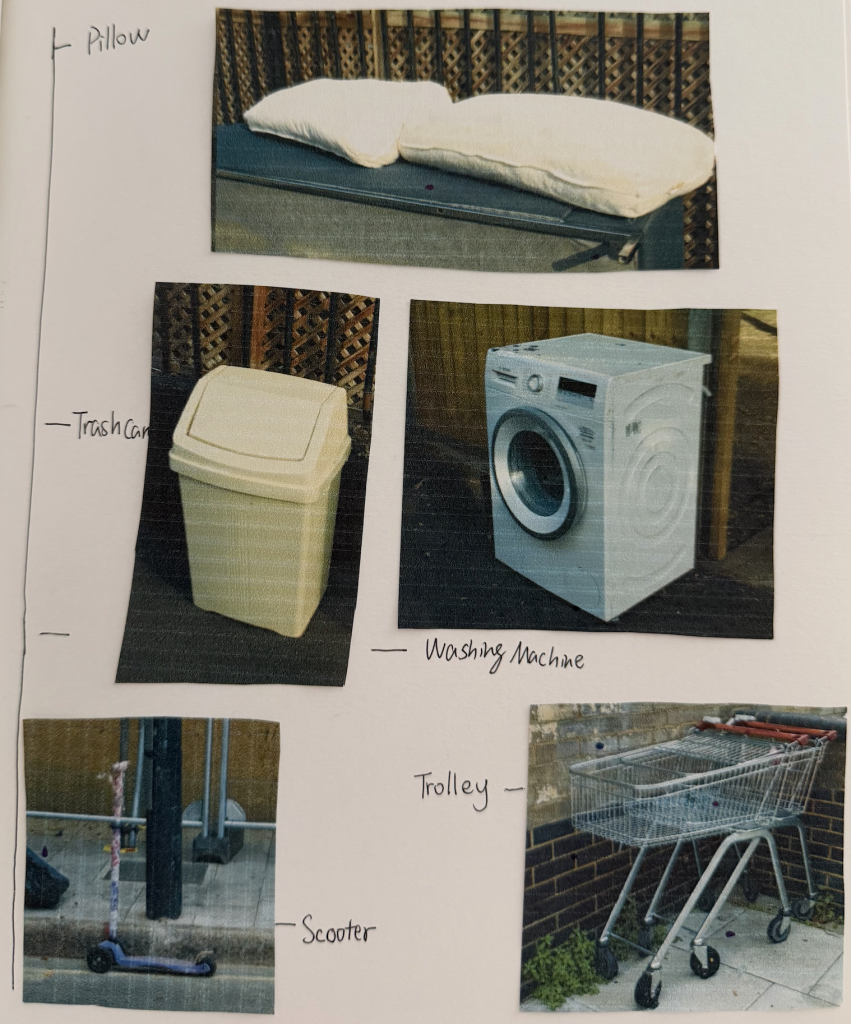
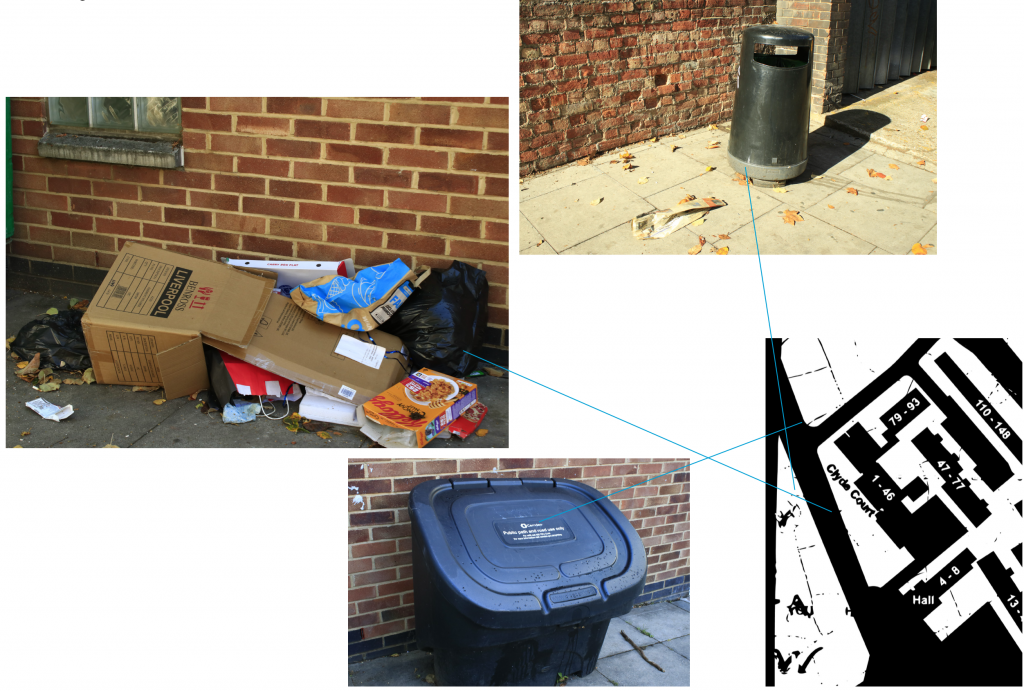
In addition to individual litter items, I also spent time identifying and mapping the static infrastructure along the street—specifically public trash cans and clusters of bulky fly-tipping. I recorded their exact GPS coordinates on Google Maps alongside the photographs.
My goal now is to overlay these two maps: one showing the distribution of everyday street litter, and the other marking public bins and large abandoned items. By comparing these spatial layers, I hope to uncover potential patterns and gaps—such as whether litter accumulates in specific “blind spots” far from public trash cans, or if the presence of bulky waste actively encourages further illegal dumping in the immediate area.
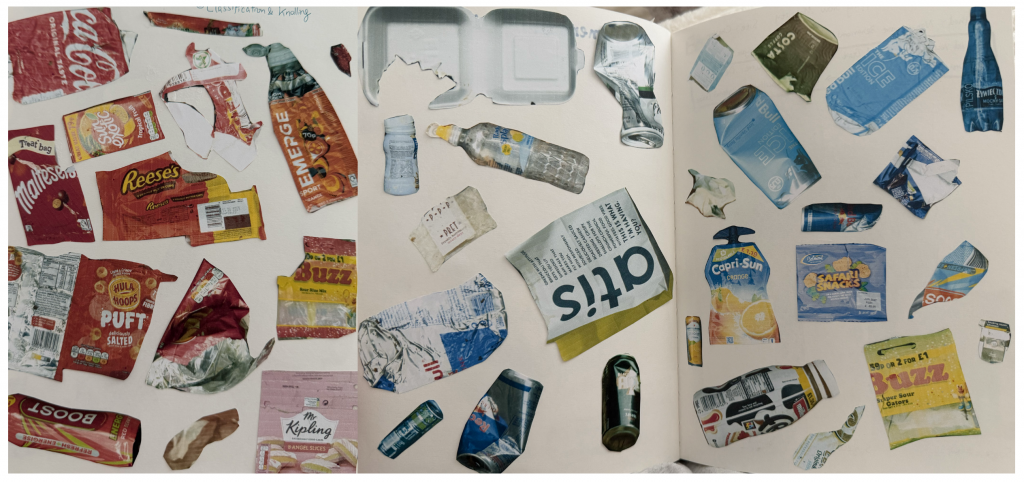
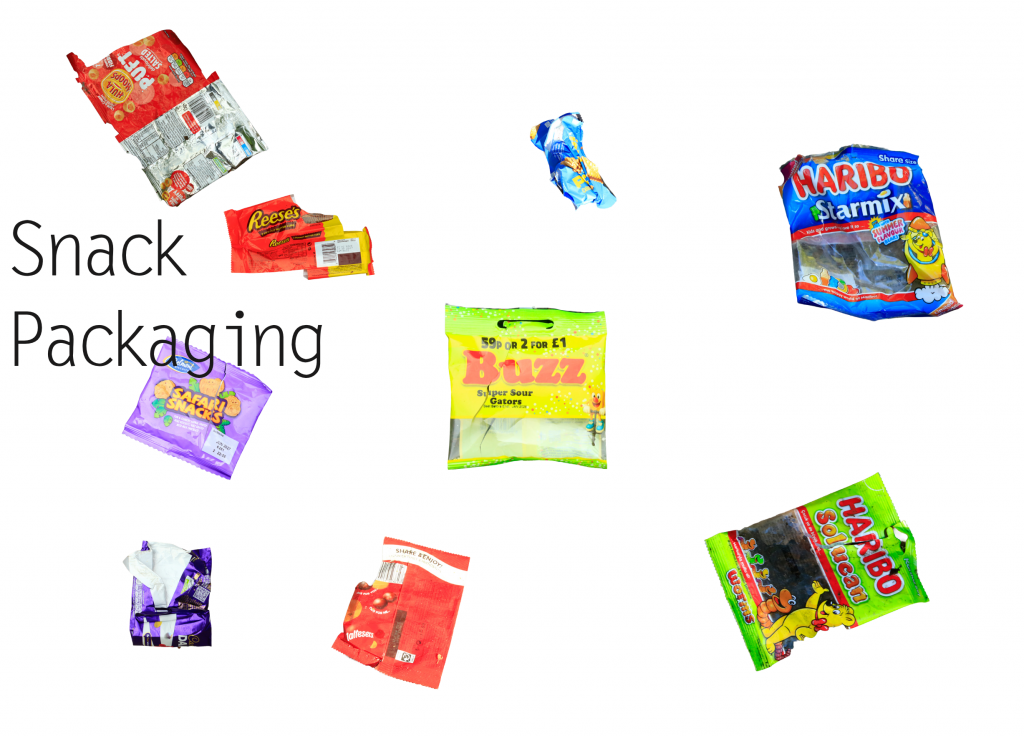
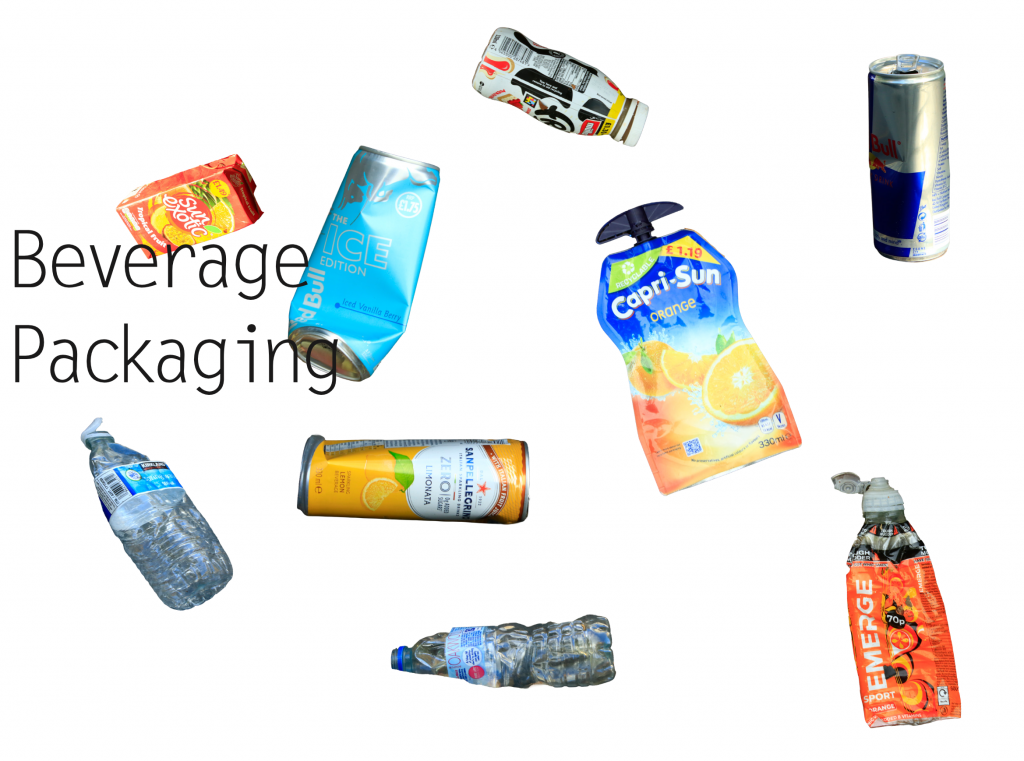
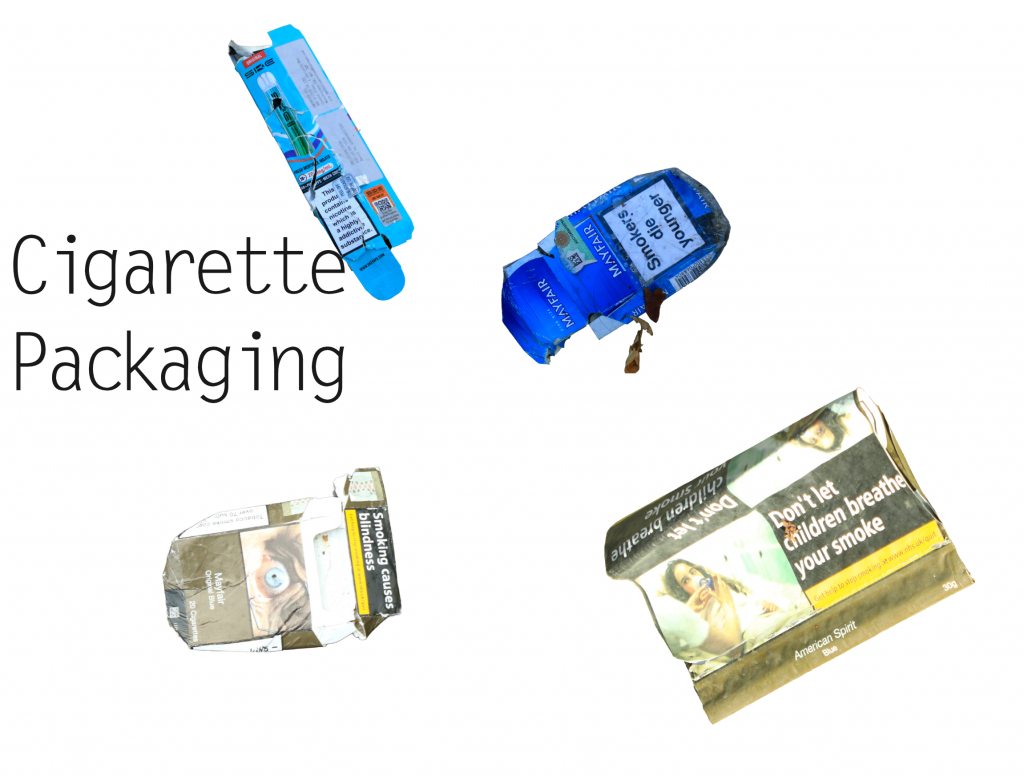
To move away from sorting things just by how they look, I tried a new way of grouping the waste based on what the items actually are: drinks, snacks, and tobacco/vaping packaging.
Sorting them like this made a big difference. It instantly showed what people are usually buying and consuming on the street. Instead of looking at them as random trash, grouping items by product type helped me see how everyday habits directly shape what gets left behind on the pavement.
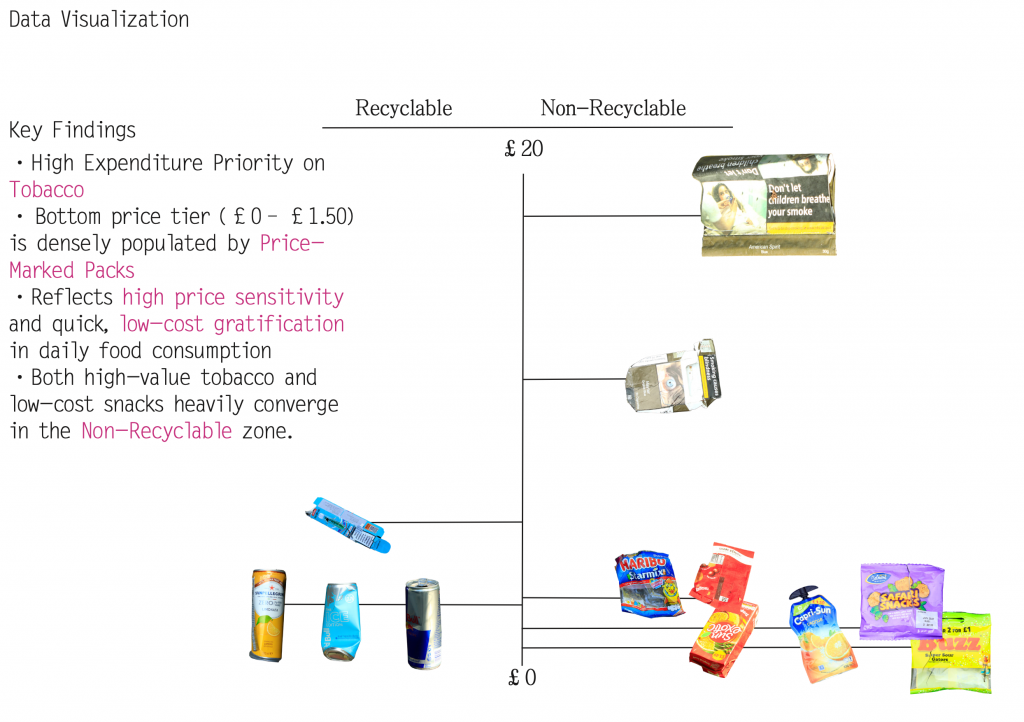
Following my tutor’s feedback, I also carried out a deeper material and economic audit of the collected waste. I analysed each item based on its brand, estimated price point, and material composition.
To make sense of these relationships, I created a data visualisation mapping all the items onto an X/Y scatter plot. The X-axis measures recyclability (ranging from fully recyclable to non-recyclable), while the Y-axis tracks the price range of the original products. By plotting these elements together, I aim to uncover whether there is a correlation between low-cost disposable items, brand accessibility, and their eventual likelihood of ending up as non-recyclable street litter.
10.2 Tutorial Feedback
During my latest tutorial, my tutor pointed out that my current color-based knolling remains somewhat on the surface—functioning more as a standard visual archive than a personal research tool. To transform this raw data into something uniquely my own, my tutor suggested a more intimate, graphic approach: high-resolution scanning. By scanning the collected packaging instead of just photographing it, I can zoom in on tactile details—focusing on local typography, brand logos, print textures, and signs of wear-and-tear.
To help me move beyond superficial classification, my tutor introduced two key reference works:
1.Batia Suter (Parallel Encyclopedia 2): Demonstrates how juxtaposing scanned images and visual fragments can build unexpected narratives beyond mere categorization.
2.Anthony Burrill (Look & See): Shows how zooming in on everyday vernacular typography and graphic language can uncover the cultural personality of a place.
Inspired by these approaches, I am shifting my knolling process from a passive sorting exercise into an active method of visual storytelling. By curating and reassembling these scanned graphic components—logos, text fragments, and material textures—I aim to develop a distinctive graphic language that reflects the street’s socioeconomic identity while making the work truly my own.