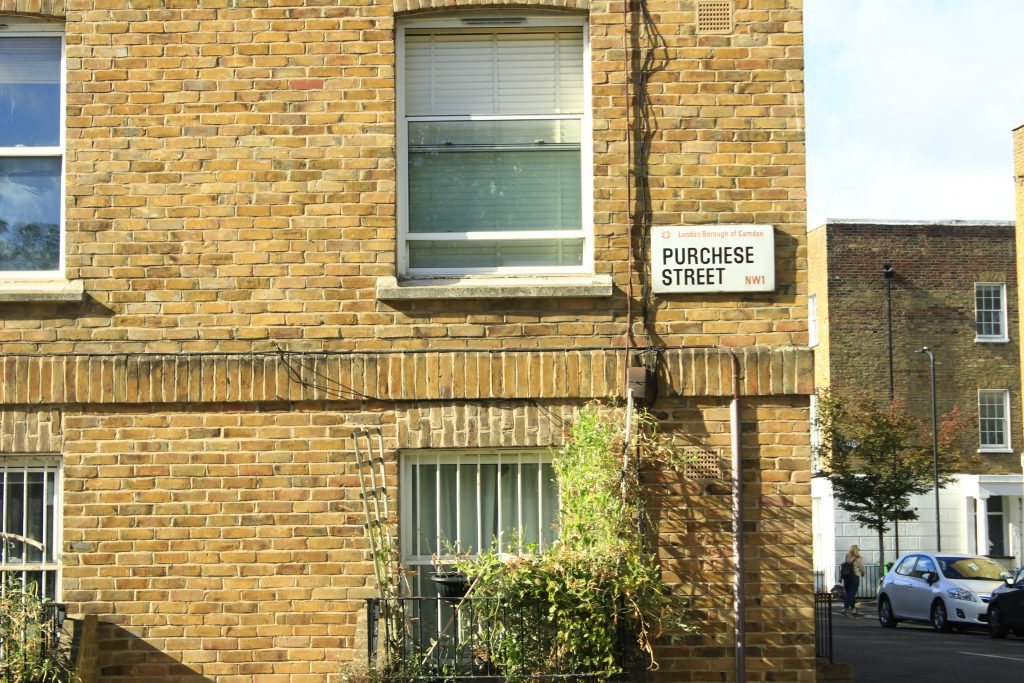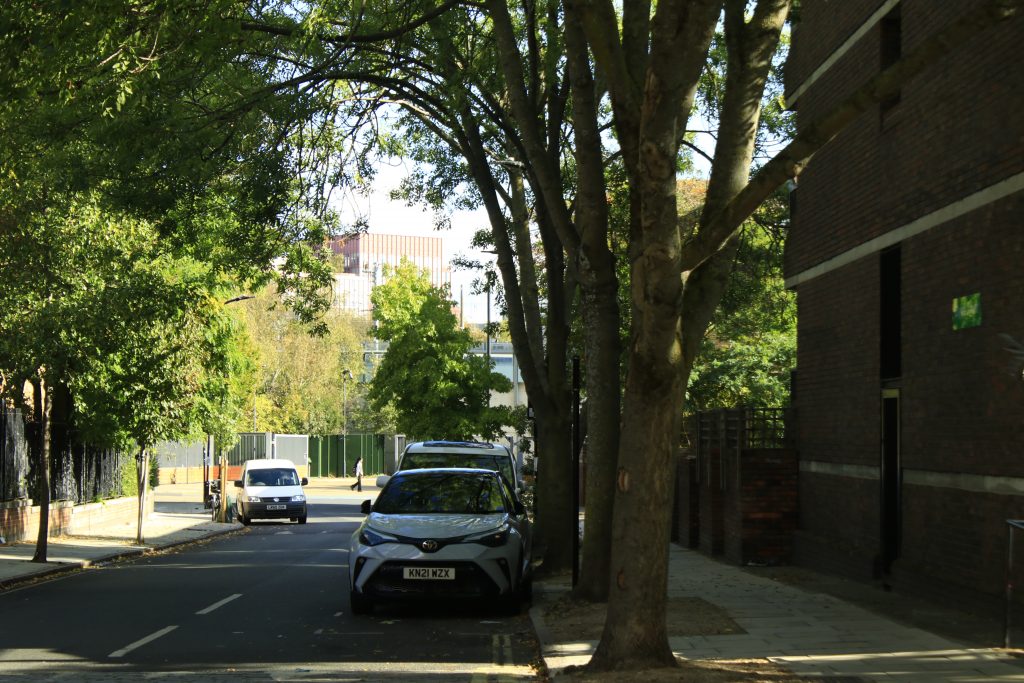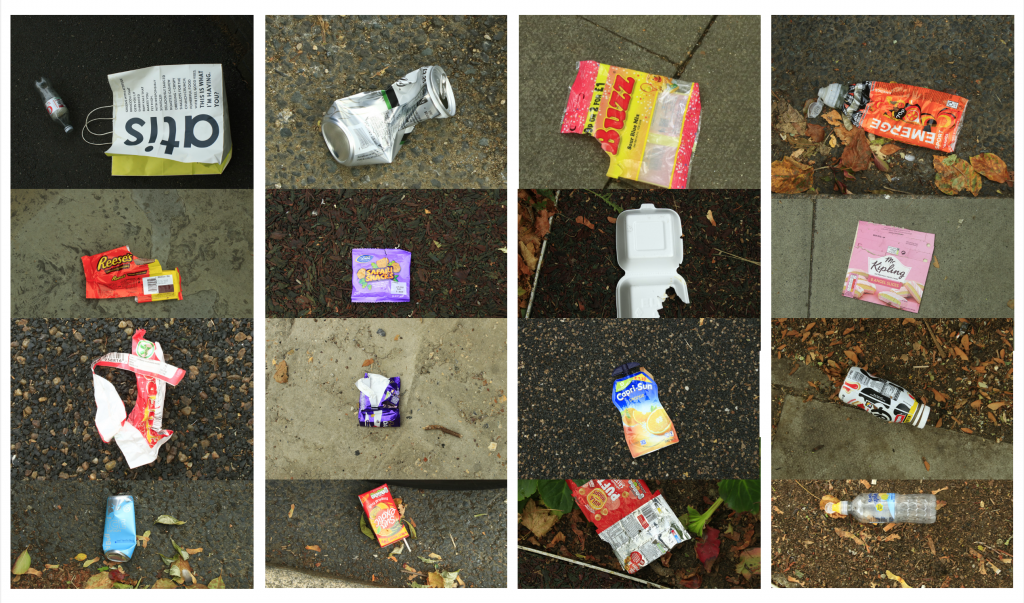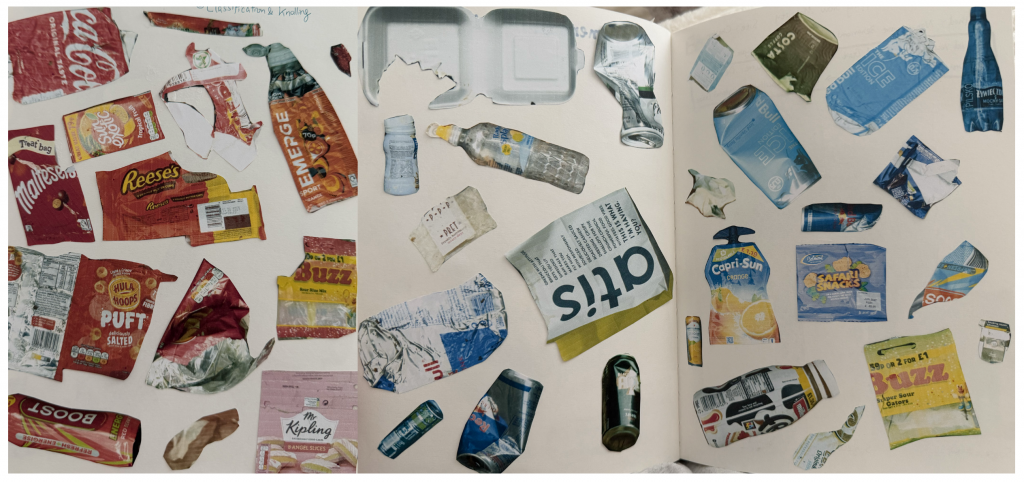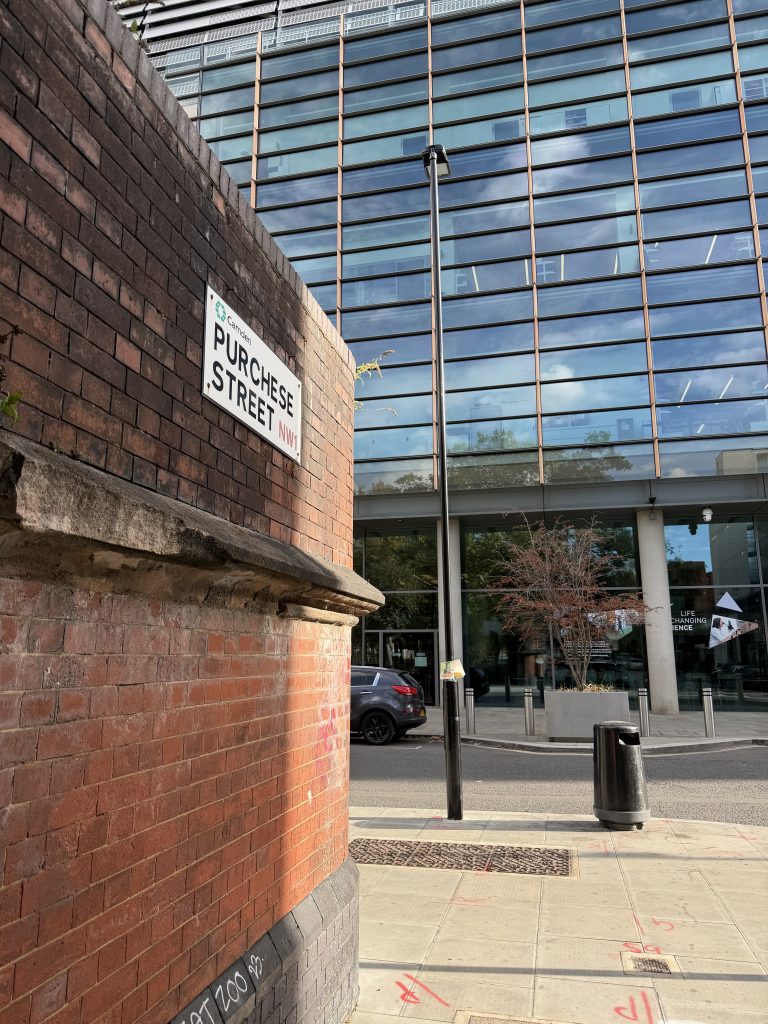
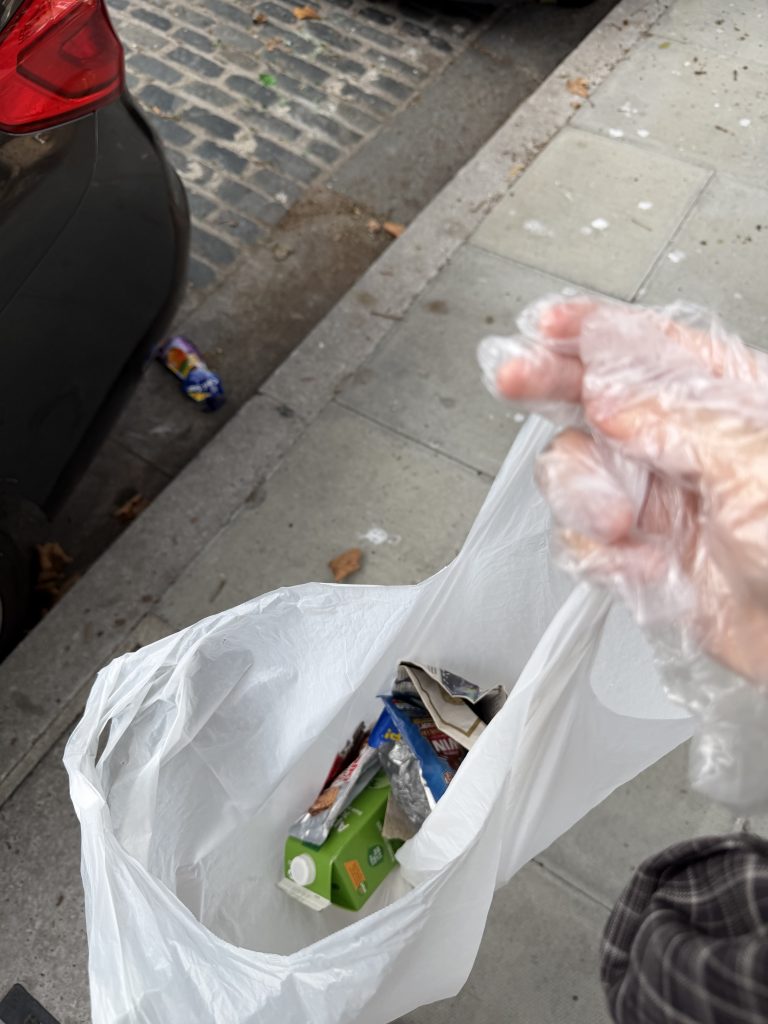
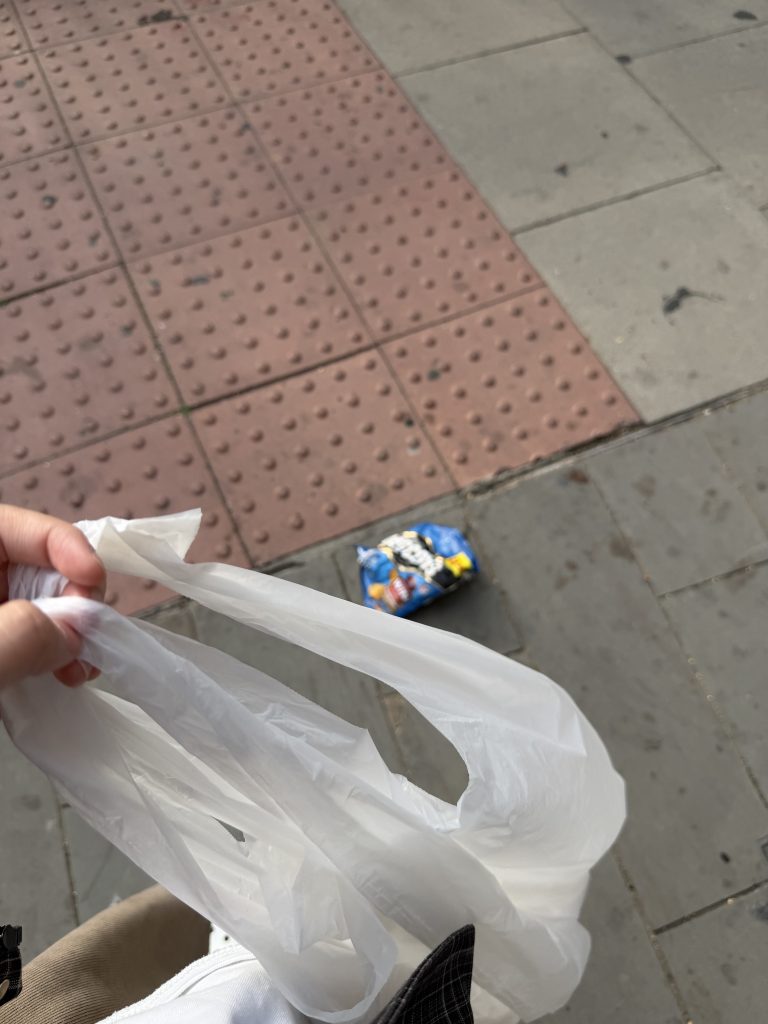
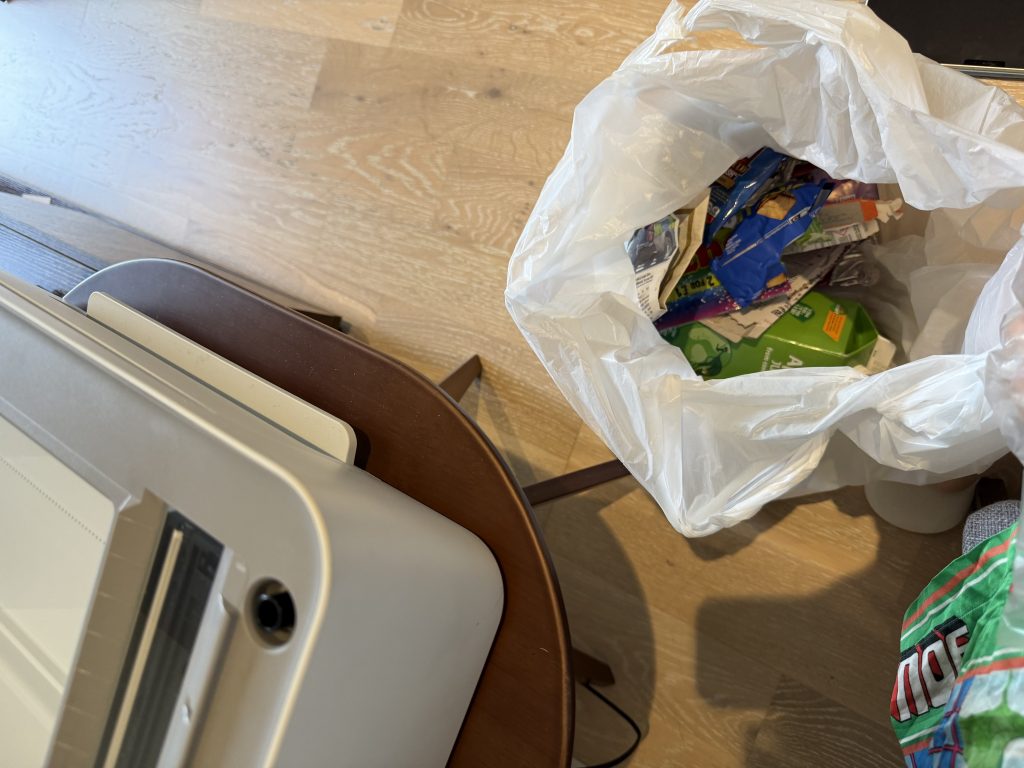
Returning to Purchese Street, I collected a new batch of street waste and brought the items back to scan them. As I placed each item on the scanner bed, examining their flattened forms and surface textures up close, I began to notice another layer of information: the physical state of the litter reveals how long it has been sitting on the street.
Many of the aluminum cans, for instance, were completely crushed and heavily scratched—clearly run over by traffic multiple times over a prolonged period, yet left uncollected. These physical signs of wear and tear offer direct visual proof of the area’s maintenance routines, pointing to a noticeable lack of regular street cleaning and municipal care in this public space.
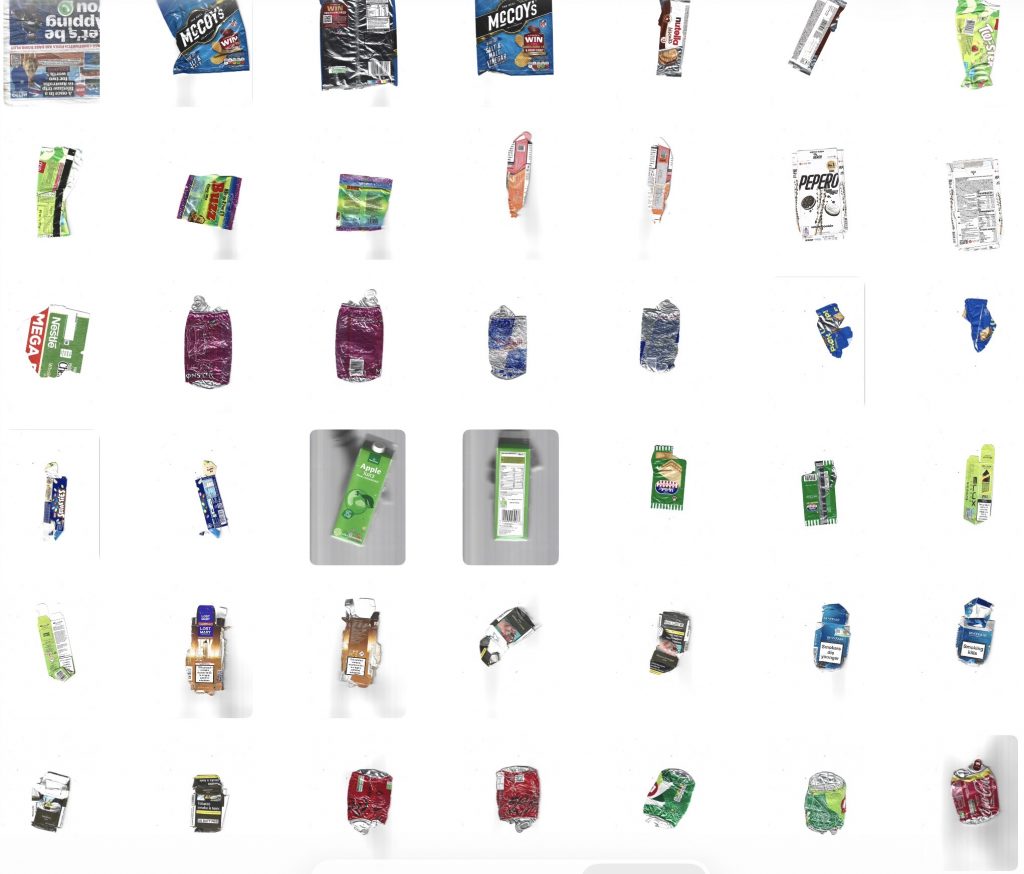
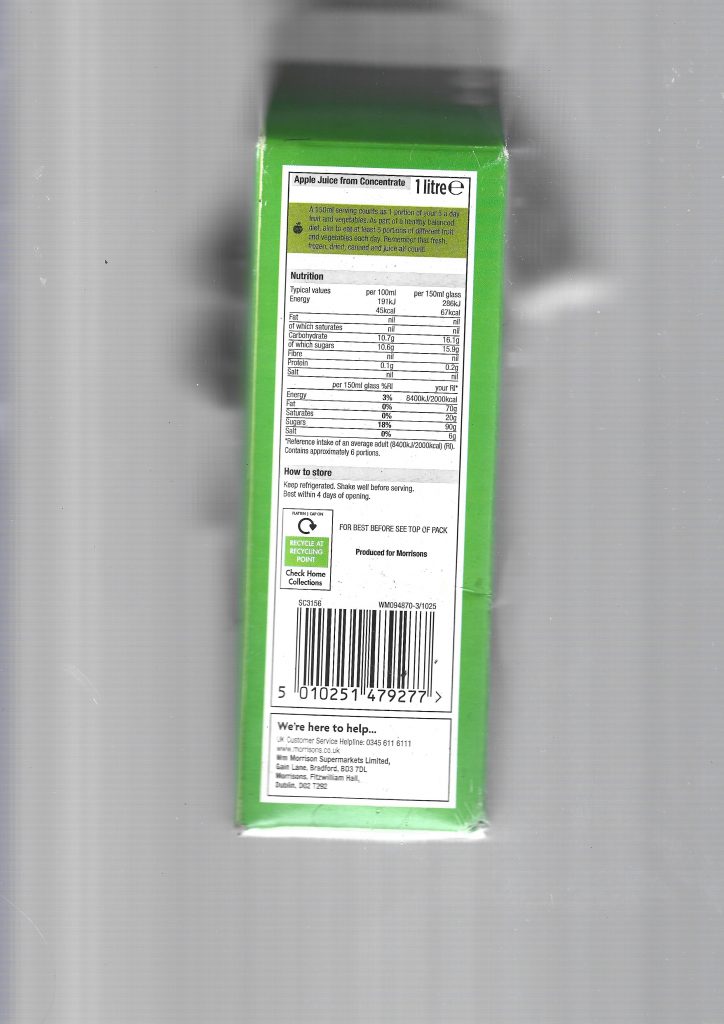
When scanning the newer litter, I ran into a practical issue. These fresher items are still 3D and bulky, making them really hard to lay flat on the scanner bed.
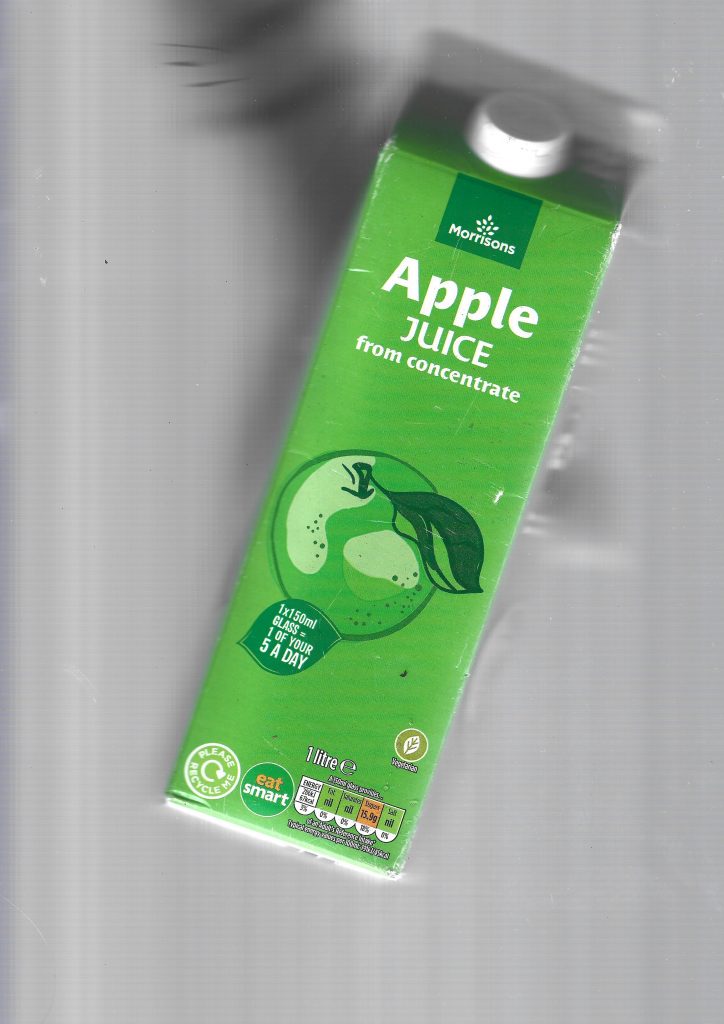
I tried pressing a juice carton down with my hand during the scan. Surprisingly, it left a subtle, blurry silhouette of my hand in the background. I actually really like this accidental detail because it records the physical act of me interacting with the trash and trying to flatten it.
I also experimented with cutting the packaging to scan it flat, but it felt like losing the integrity of the original object. Keeping the packages intact, even if it leaves motion blurs and hand prints, captures a much more honest story of the scanning process itself.
When I was only using a camera, my knolling process was quite limited. I was basically just taking photos of one flat side of each item. Moving to scanning changed how I look at these objects entirely because it lets me capture every single surface. Scanning all sides of a juice carton or a snack wrapper brings out every graphic detail, from the big brand logos on the front to the tiny ingredients, barcodes, and recycling symbols hidden on the sides. It turns each piece of waste into a full set of graphic components rather than just a static photo.
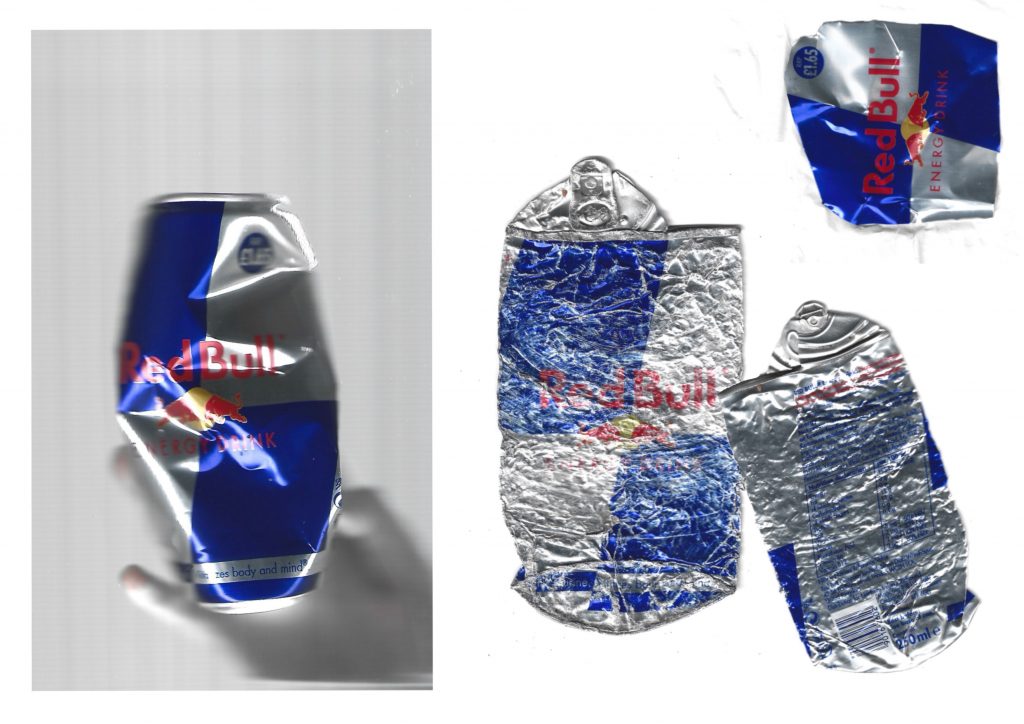
Regarding the feedback on methodology, I began to focus on “narrative stacking” rather than simple logical classification. In this exploration, I selected Red Bull aluminum cans and arranged them together. In addition to brand classification, I decided to observe their physical state through the perspective of the scanner. As you can see, there is a clear visual evolution here. A jar still retains a certain sense of three-dimensionality. It may just be discarded not long ago, and I need to cut it or press it by hand to scan it. The other is completely flattened and severely deformed, and their physical form is like a biography. You can almost estimate how long each jar has been on the street. Some are only a few hours, and some are up to weeks. They have been run over by vehicles many times and are completely unmanaged.
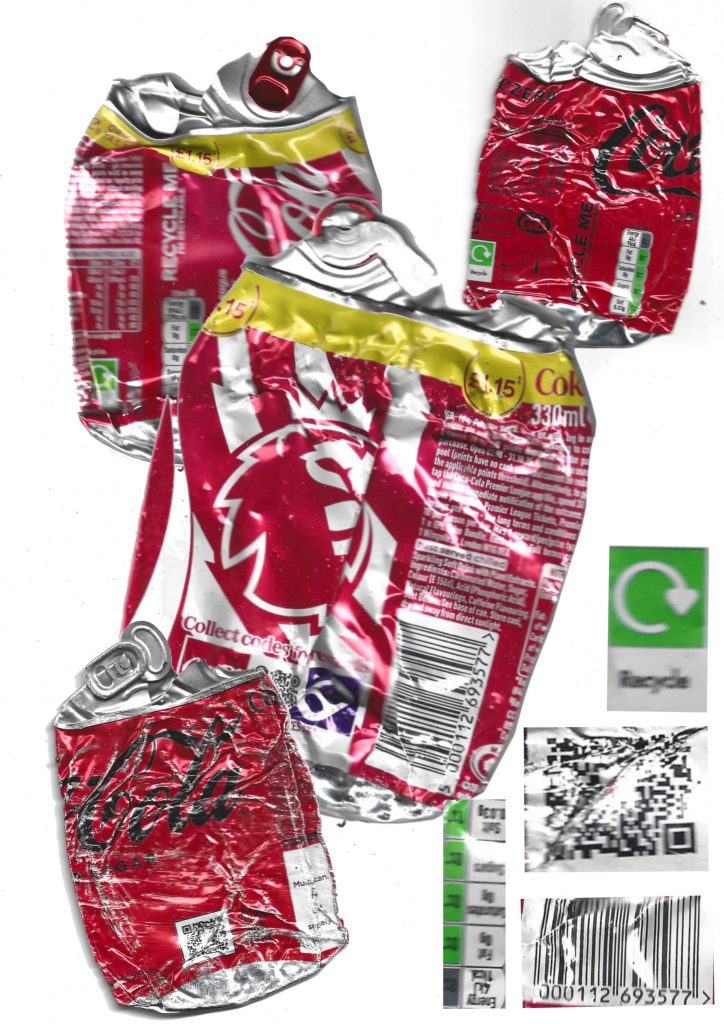
In my next round of experiments, I began to deconstruct the performance of an iconic brand in multiple discarded items. I collected several different cola aluminum cans and arranged them. I separated and extracted specific non-colour graphic elements: black barcodes, tiny black text warnings, small green recycling logos, and even greyscale elements such as QR codes, juxtaposed with red jars. I began to examine the visual operation of different levels of graphic communication, strong marketing orientation “red” and How is the unified packaging integration between the “black/green” elements that only contain information?
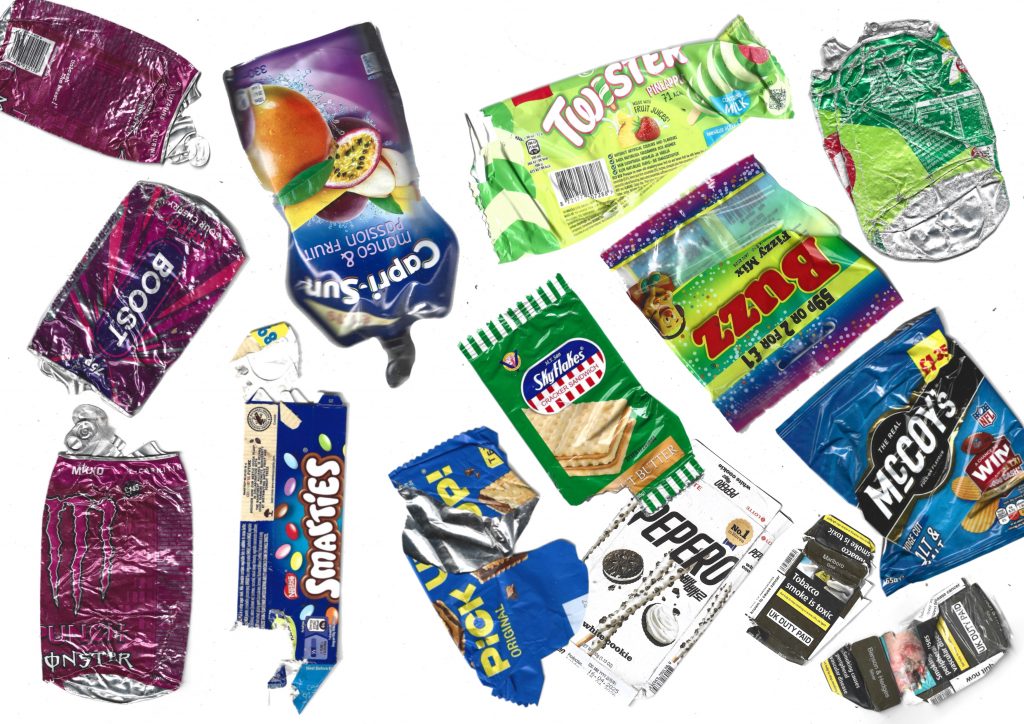
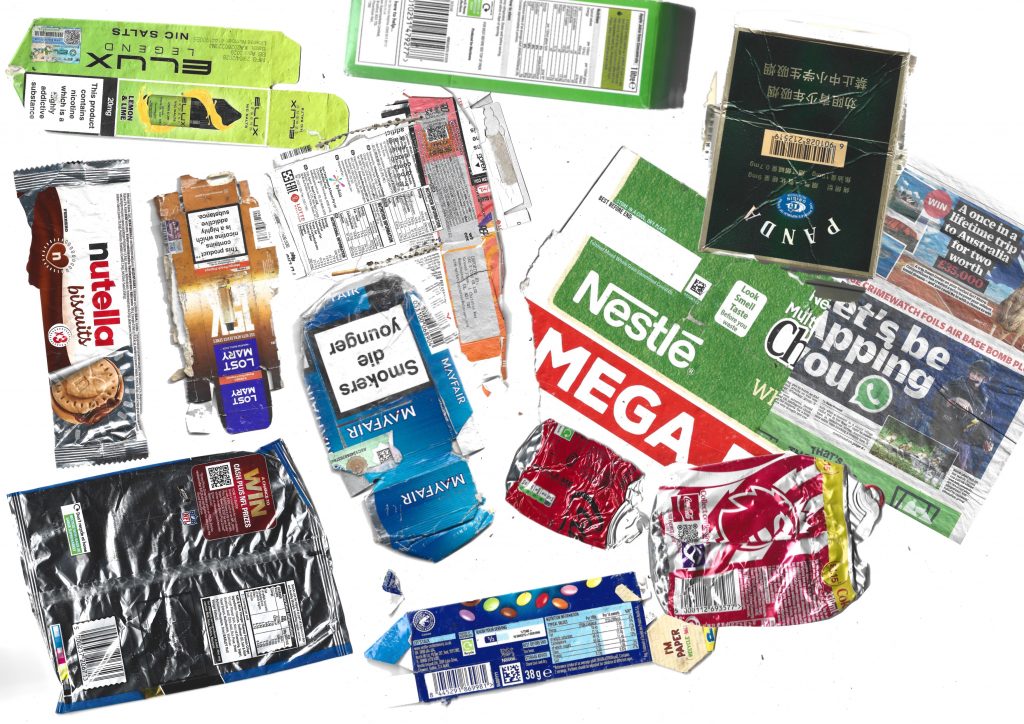
In the iteration, inspired by Batia Suter’s work, I completely abandoned the way of classifying by product type and focussed entirely on visual association. I want to see how the packaging from unrelated products is interconnected. I connect items with each other based on similar elements. They can be arranged according to colour or through shared patterns and graphics.
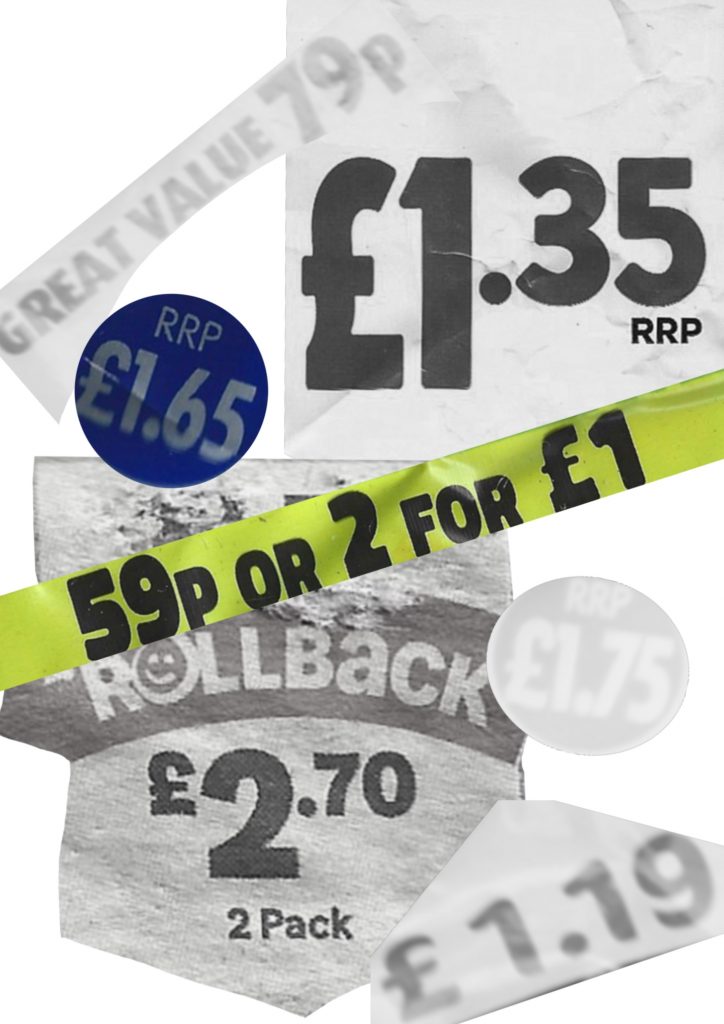
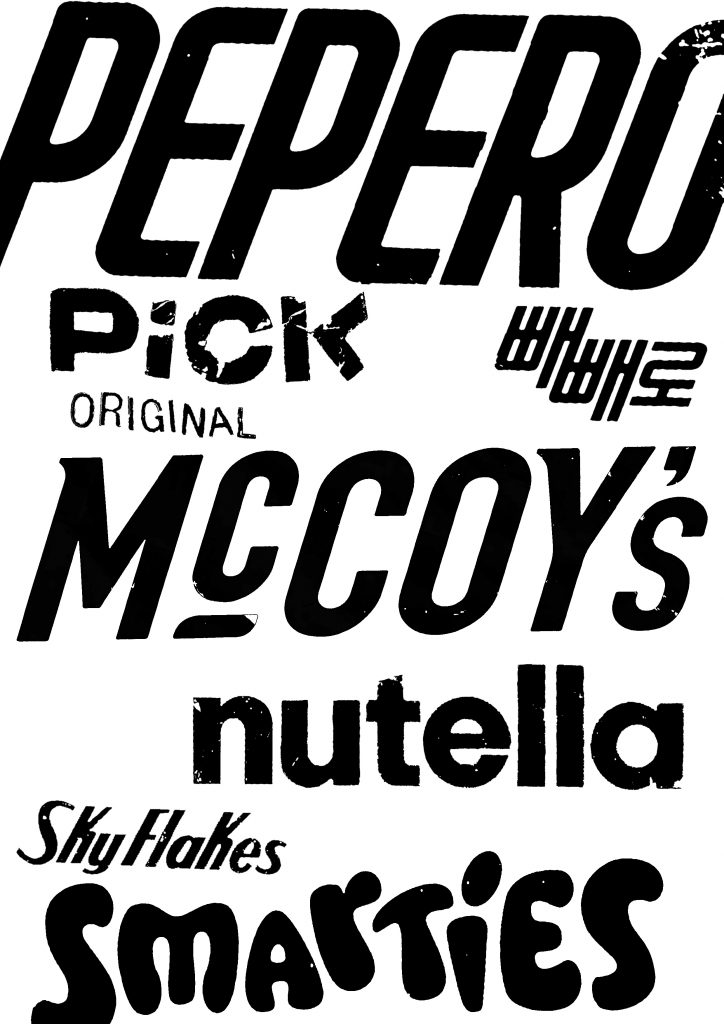
Inspired by Anthony Burill in Look and See, I further promoted the deepening of graphic research by separating specific visual elements from the scanned packaging. Instead of maintaining the integrity of the item, I extracted two different graphic levels: price tags and brand logos.
On the left, I group the price tags and promotional stickers. Highlighting these numbers alone highlights their bold, aggressive typesetting and direct visual urgency. These price tags are designed to attract attention on the shelves, using thick sarif fonts and high-contrast shapes.
On the right side, I extracted the brand logo and converted it into a simple black-and-white typesetting collage. After removing its iconic colours, it shows the original characteristics and diversity of their customised fonts.