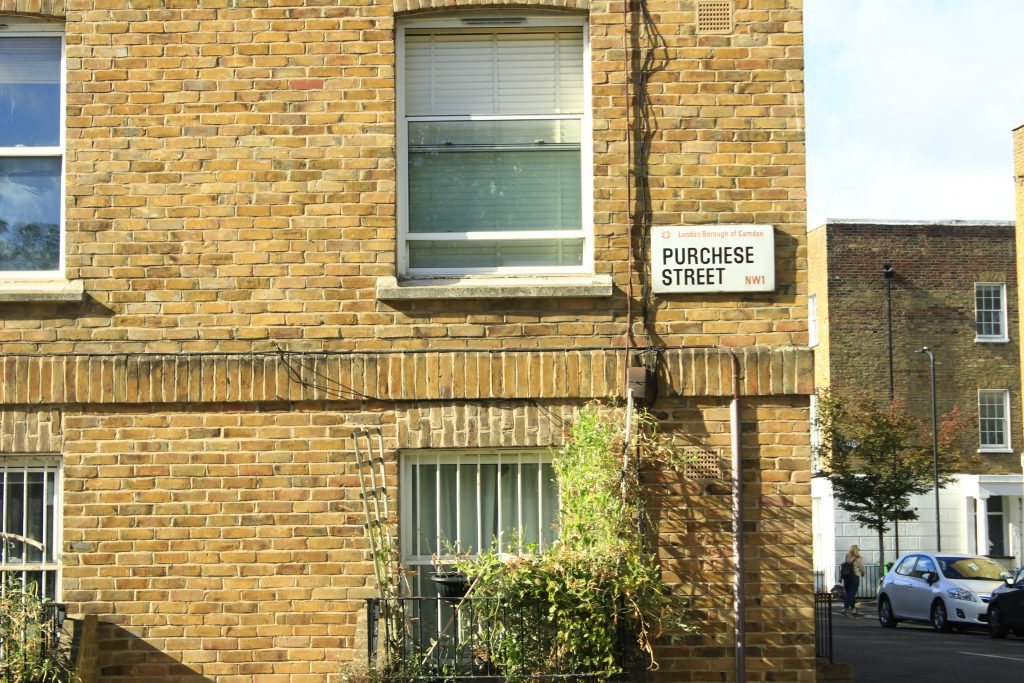
Located close to King’s Cross, Purchese Street sits within a very different social and commercial landscape. Despite their physical proximity, the two areas reveal contrasting forms of retail, public space and everyday consumption.
Spatial Observation
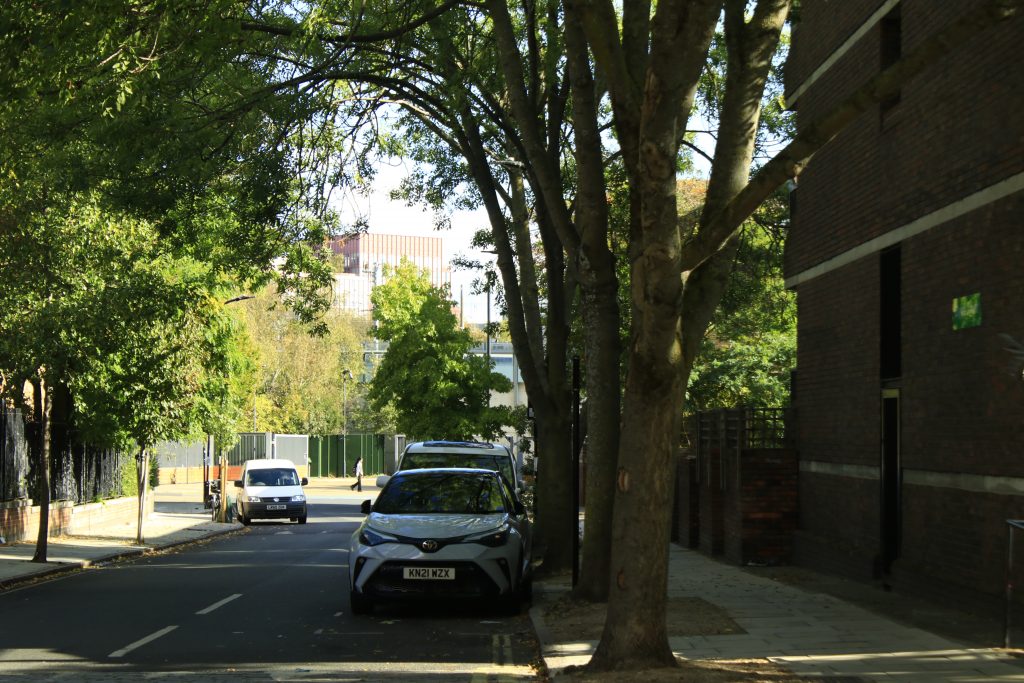
View towards King’s Cross from Purchese Street.
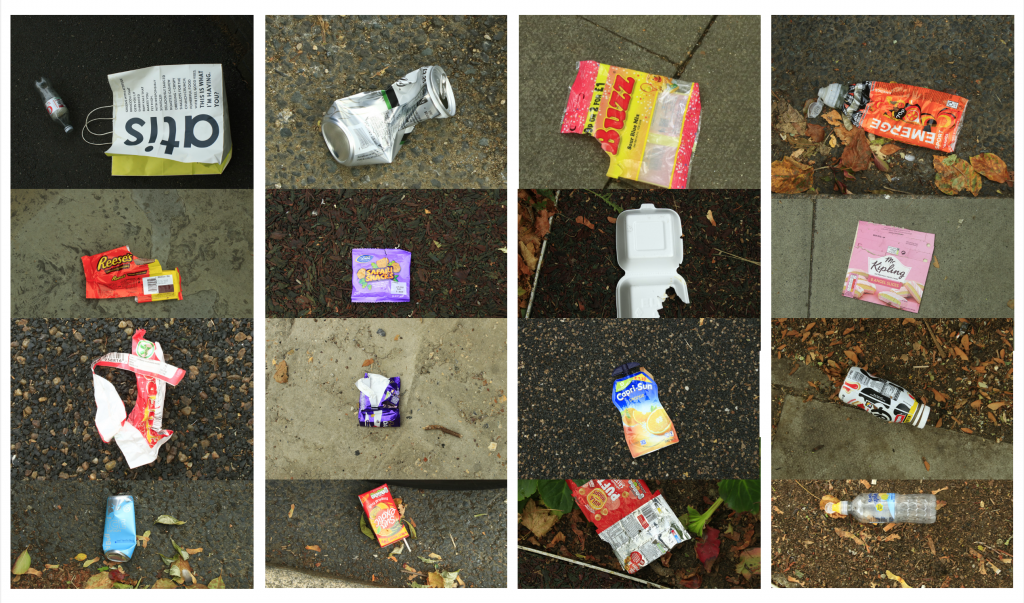
Method 1: Knolling
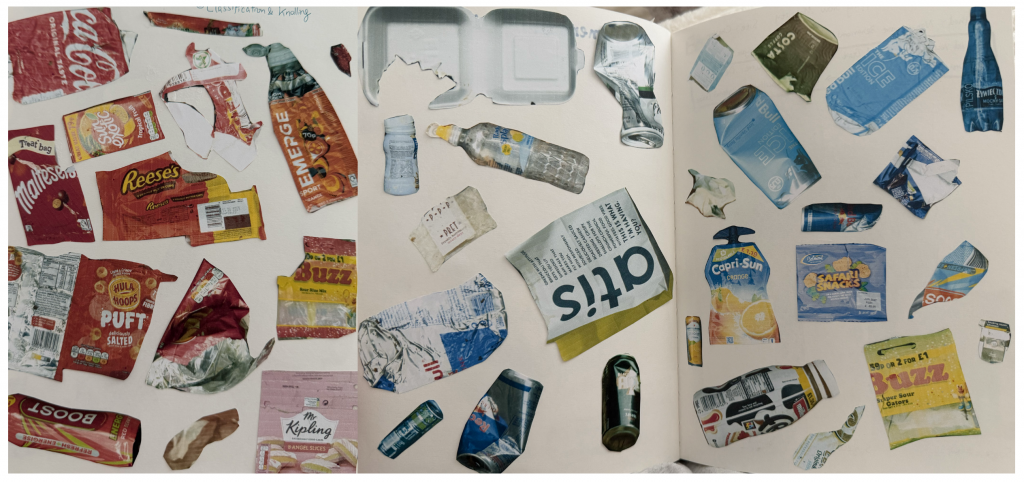
My initial fieldwork began with a stark spatial contrast: as I walked away from the privately managed King’s Cross area into Purchese Street, I noticed a sudden surge in street litter. To document this visual anomaly, I photographed the abandoned items, printed and hand-cut their forms, and organised them into color-coordinated knolling layouts in my sketchbook. This tactile mapping process allowed me to analyse both their material composition and visual presence.
Method 2: Mapping human movement
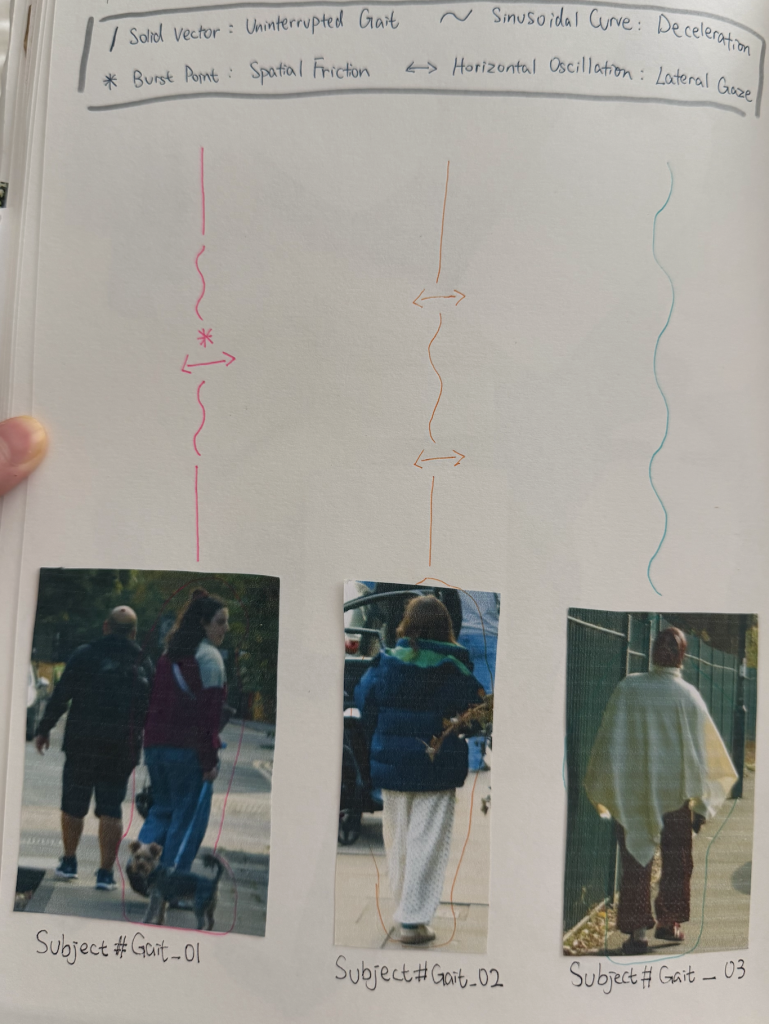
After looking at street waste, I turned my focus to the people walking through the neighborhood. To record how people move along Purchese Street, I created a simple drawing system. A straight line shows someone walking at a steady speed, while a wavy line shows them slowing down or hesitating. When someone stops or looks around, I marked it with star points or side-to-side arrows. Instead of just tracking where people were going, this method helped me notice how the street environment naturally changes people’s walking pace.
Method 3: Documenting Bulky Fly-Tipping on the Street
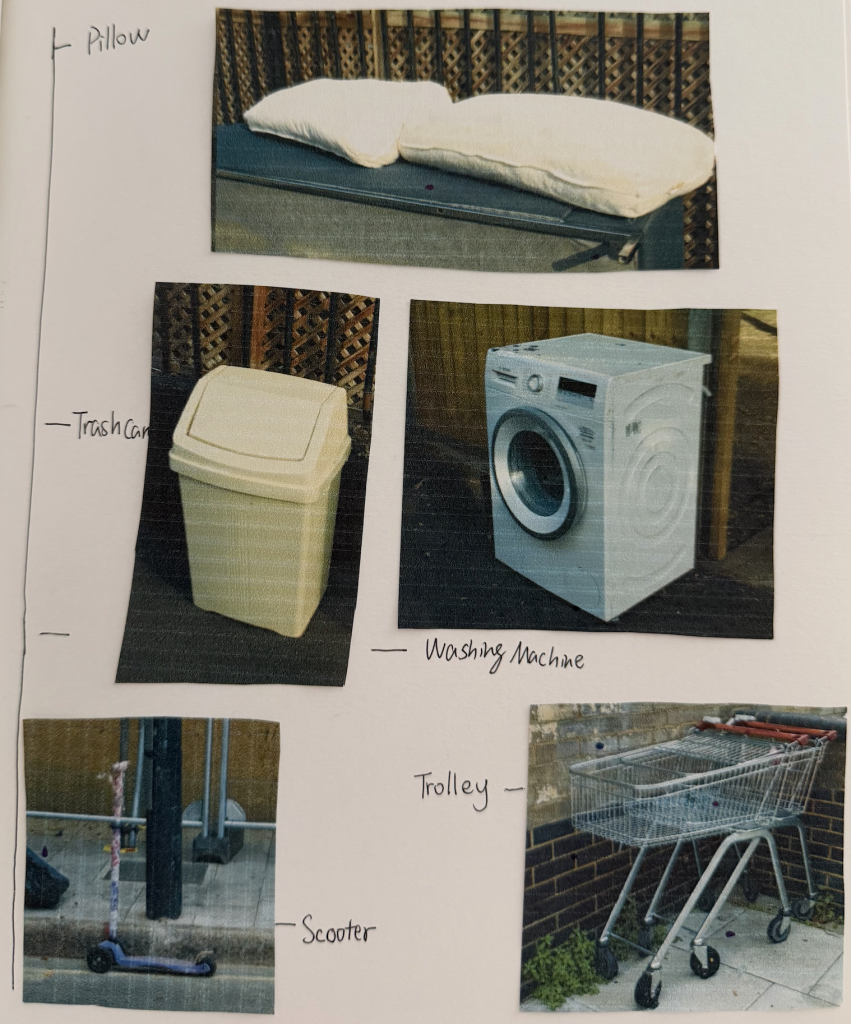
Beside small packaging, I also noticed larger discarded items along the street, like pillows, a washing machine, a trash can, a scooter, and a shopping trolley. I photographed these bulky items and categorized them in my sketchbook along a scale. Seeing intimate domestic objects and heavy appliances left out on the pavement highlights how private household waste overflows directly into public spaces.
9.25 Tutorial Feedback
During my tutorial on September 25, I shared my initial experiments with color-based knolling and received some insightful feedback from both my tutor and peers.
My tutor noted that while arranging waste by color is a strong visual starting point, I shouldn’t limit myself to just one dimension. They suggested pushing the analysis further by categorising items through brand identity, materiality, and price point. Meanwhile, my peers recommended taking a more spatial approach by mapping the exact locations where each item was found and recording their physical dimensions.
Taking these suggestions forward, my next step is to analyze the collected waste by brand and price, while mapping their precise locations on site. My goal is to see what new spatial patterns and socioeconomic stories might emerge from these deeper layers of data.
Leave a Reply